- Commodities
- Data and Research
Companies Can Find Deforestation-Free Soy in Brazil’s Cerrado, Thanks to New Data
Dec 20, 2016||4 minutes
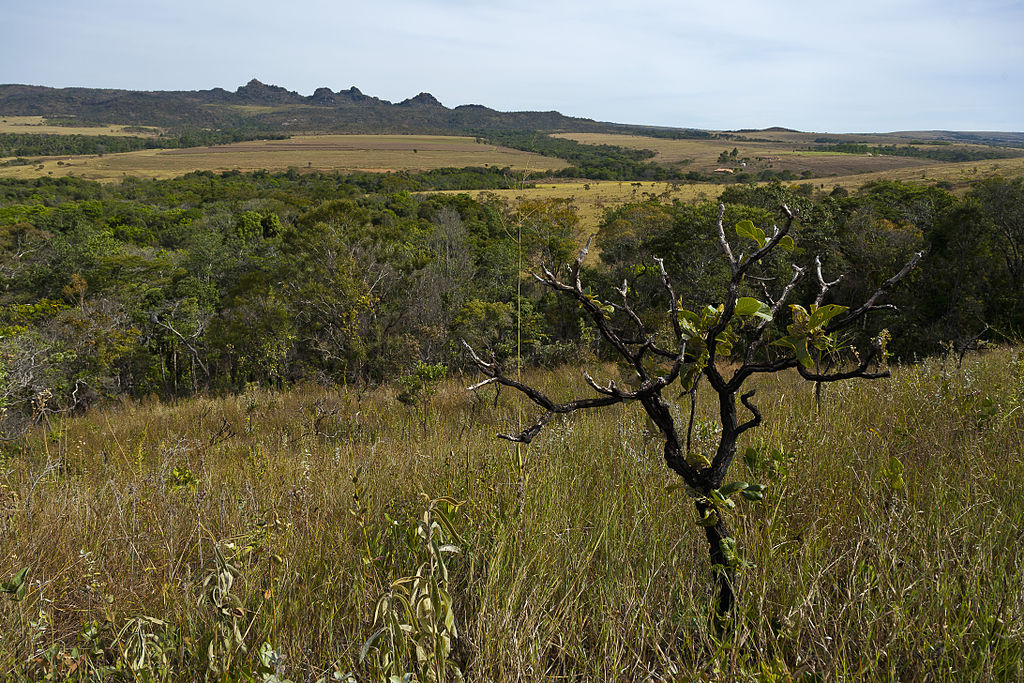 Cerrado Parque Estadual dos Pirineus by Jonathan Wilkins via Wikimedia. The photo is licensed under the Creative Commons Attribution-Share Alike 3.0 Unported license.
Just ten years ago, Brazilian soy’s reputation was at an all-time low for its links to deforestation in the Amazon. The industry, environmental NGOs and the Brazilian government reacted swiftly to establish the Amazon Soy Moratorium, one of the most successful efforts ever to limit agricultural expansion in tropical forests. Earlier this year, the policy commemorated its 10th anniversary and was renewed indefinitely. The Moratorium has rightly been a cause for celebration for its success in the Amazon; however, it has inadvertently distracted attention away from continued expansion of soy into forest elsewhere in South America, particularly in the Cerrado. The Cerrado, which covers roughly one-fourth of Brazil, varies from dense forest, like the neighboring Amazon, to savannah and native grassland and contains enormous biodiversity. Yet it is among the most threatened biomes in South America. Soy planting in this biome, for example, has more than doubled in area since 2001, covering nearly 8 percent of it in 2014. New data on Global Forest Watch (GFW) Commodities shines much-needed light on the scale of forest loss that preceded soy expansion in the Cerrado. The data was developed by a team at Agrosatélite led by Bernardo Rudorff, a leading expert in satellite monitoring of cropland, and it shows soy production in the Cerrado for crop year 2013/2014. When analyzed with GLAD annual tree cover loss data, users, like soy buyers, can see how recently those areas were cleared and make sourcing decisions to discourage further expansion of soy in the Cerrado’s remaining forests.
While determining the cause of deforestation, legality and environmental compliance requires more information, including property-level documentation, these two datasets together provide useful insights for sourcing deforestation-free soy.
The Cerrado’s highest-risk areas
The analysis feature on GFW Commodities compares the Cerrado soy data with annual tree cover loss to produce a Recent Loss Index, which tells users how recently an area of planted soy was cleared. On a scale of zero to one, a higher Recent Loss Index indicates more recent tree cover loss, suggesting a higher likelihood that the planting of soy is connected to the recent clearing in that area. Since the Index reveals the areas with the most recent tree cover loss, soy buyers (traders, manufacturers and consumer goods companies) with zero-deforestation commitments can use this information to identify areas that do not meet their sustainable sourcing criteria.
 The analysis report shows the Recent Loss Index (scaled from zero to one). The higher the Index, the more recent the loss in that area occurred on average (read our technical blog for more details). The data also quantifies the loss per year (left) and indicates the year in which tree cover loss occurred in areas as small as 30×30 meters on which soy is grown (right). Click to enlarge.
GFW analysis of all municipalities in the Cerrado found that more than half of the soy growing on land that was recently cleared (2008 or later) was concentrated in the top 5 percent of municipalities. The northeast region called “MATOPIBA,” (where the states of Maranhão, Tocantins, Piauí and Bahia come together) had more areas with most recent loss than anywhere else—25 of the top 30 municipalities ranked by highest Recent Loss Index values were located there. Meanwhile, Mato Grosso do Sul, southern Mato Grosso and Minas Gerais had the most area of soy planted on land with more historical loss (i.e. loss closer to 2001 or earlier).
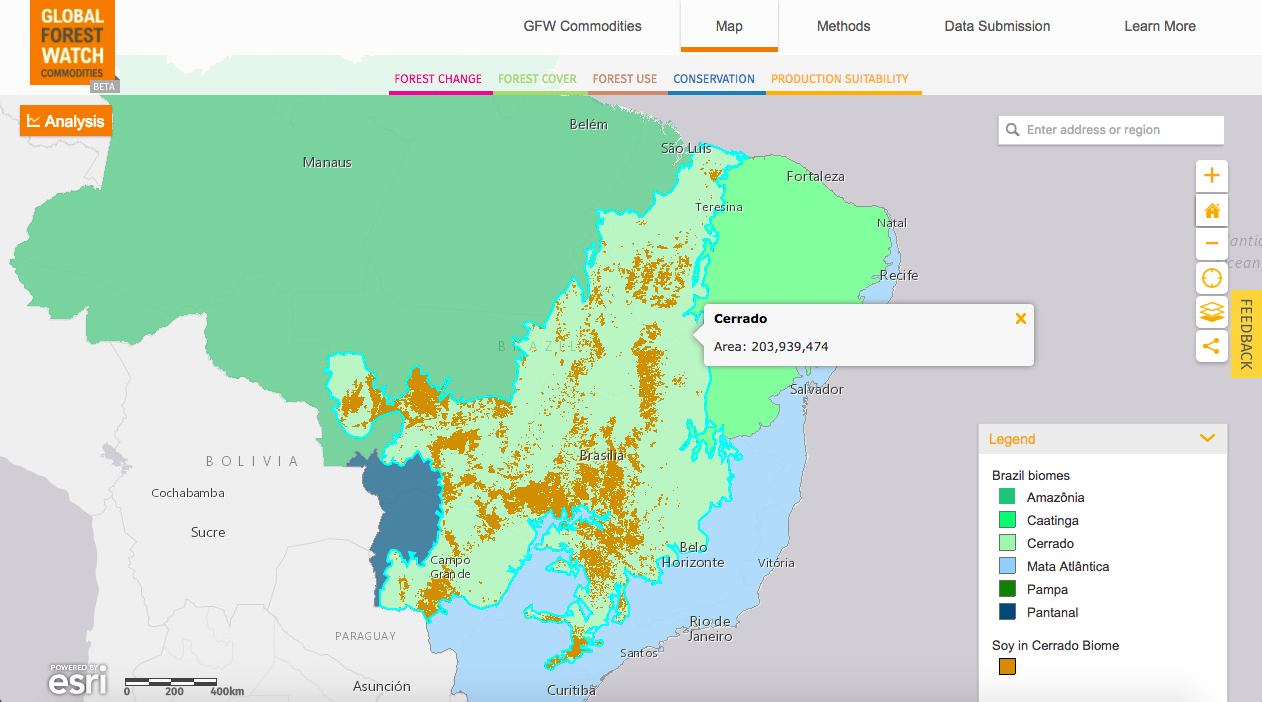
 This map analyzes tree cover loss on land where soy is now grown. Dark brown indicates areas with most recent tree cover loss, while yellow indicates the most historical forest loss. Click to enlarge.
Since both the soy and tree cover loss data are at 30-meter resolution, users can drill down to the field level to see exactly which lands have been cleared and how recently. This is important as recently and historically cleared areas (e.g., where the land may have been pasture before soy was planted there) are often adjacent to one another, so some soy even in a high-risk region may be deforestation-free and in compliance with a company’s zero-deforestation policy.
The Next Milestone: Deforestation-free Cerrado Soy
There are many challenges to making all soy in the Cerrado deforestation-free, but success in this biodiversity hotspot is critical to achieving global deforestation goals. Forest clearing in the Cerrado can be technically legal, and the lack of a moratorium makes it difficult for sustainability-minded companies to avoid buying soy that is linked to deforestation, especially as others support that market. Although this data show that much of the soy in the Cerrado is grown in low-risk areas, there remain high-risk areas. The Recent Loss Index will help responsible companies source more sustainably as well as engage in conservation and restoration efforts where they are most needed.
Learn more about the data by reading our technical blog. BANNER PHOTO: Cerrado Parque Estadual dos Pirineus by Jonathan Wilkins via Wikimedia. The photo is licensed under the Creative Commons Attribution-Share Alike 3.0 Unported license.
Explore More Articles

Oct 16, 2019|Data and Research|5 minutes
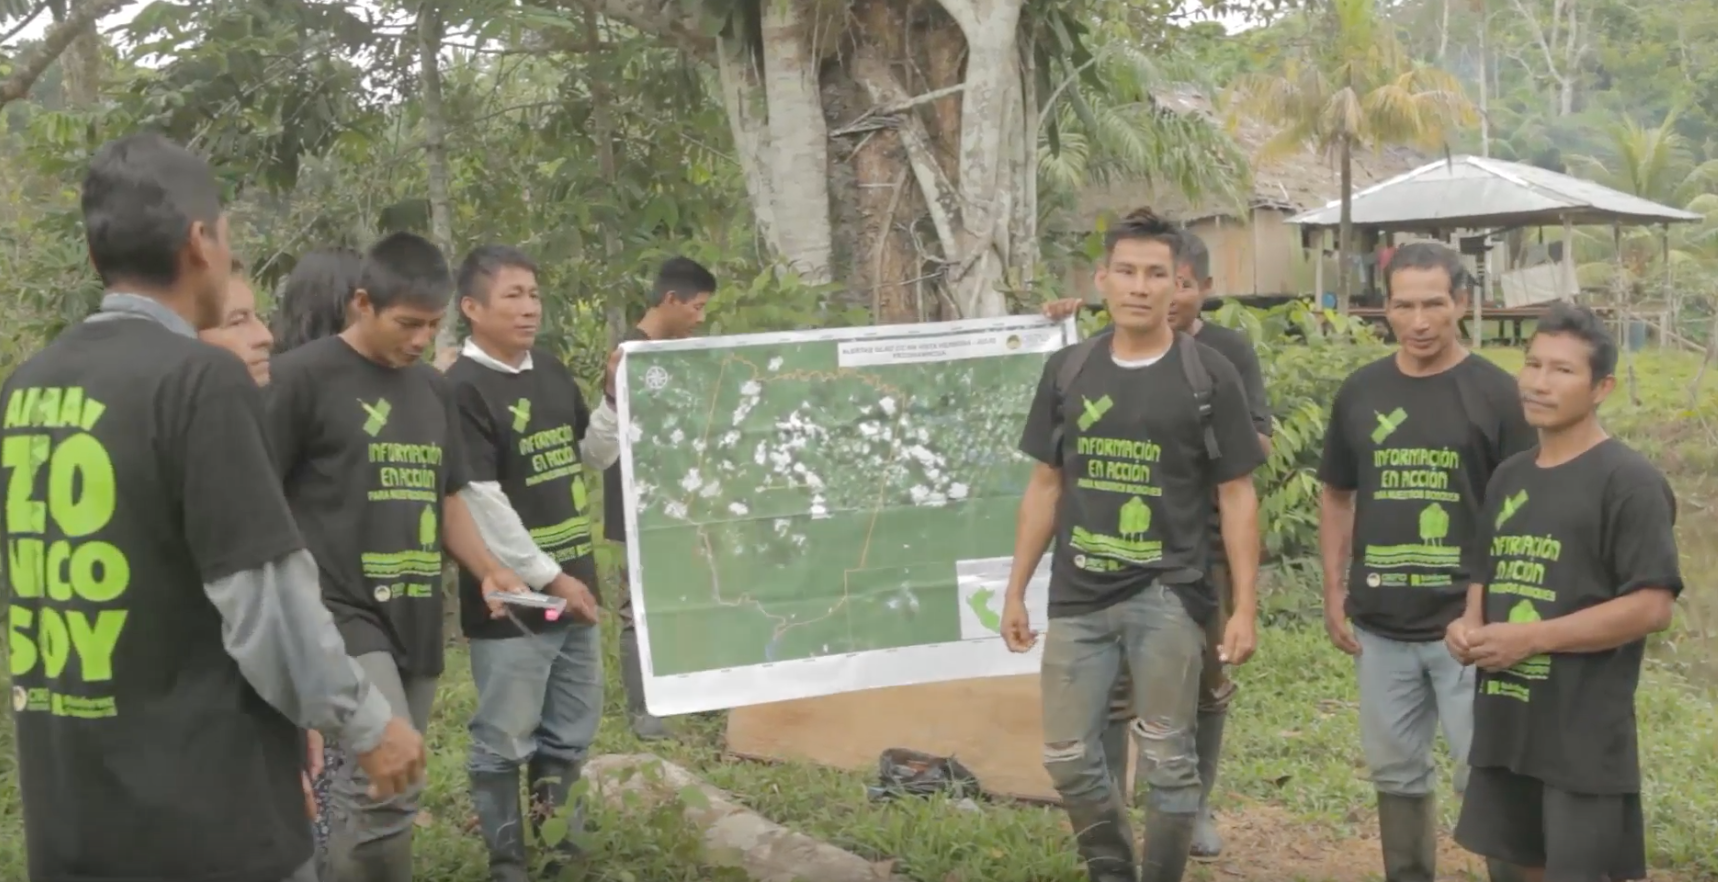
Triumphs and Challenges of Using Deforestation Alerts in Peru
In 2016, Global Forest Watch (GFW) and the University of Maryland released the world’s most detailed satellite-based deforestation alerts. Since the launch, the GLAD alert system has expanded from just three countries to the entire tropical region and is accessed by hundreds of thousands of users through GFW. Peru’s Early Warning Alerts After using the GLAD deforestation alerts, […]
Dec 27, 2017|Data and Research|6 minutes
A Year in Review: Global Forest Watch Highlights from 2017
It’s been another busy year for Global Forest Watch! This year we focused on putting the right data into the hands of our users to support action on the ground. We added more local data and made it easier than ever for decision-makers and on-the-ground forest monitors to access the information they need through national […]
Explore More Articles


