Placing Global Wildfires into Local Context
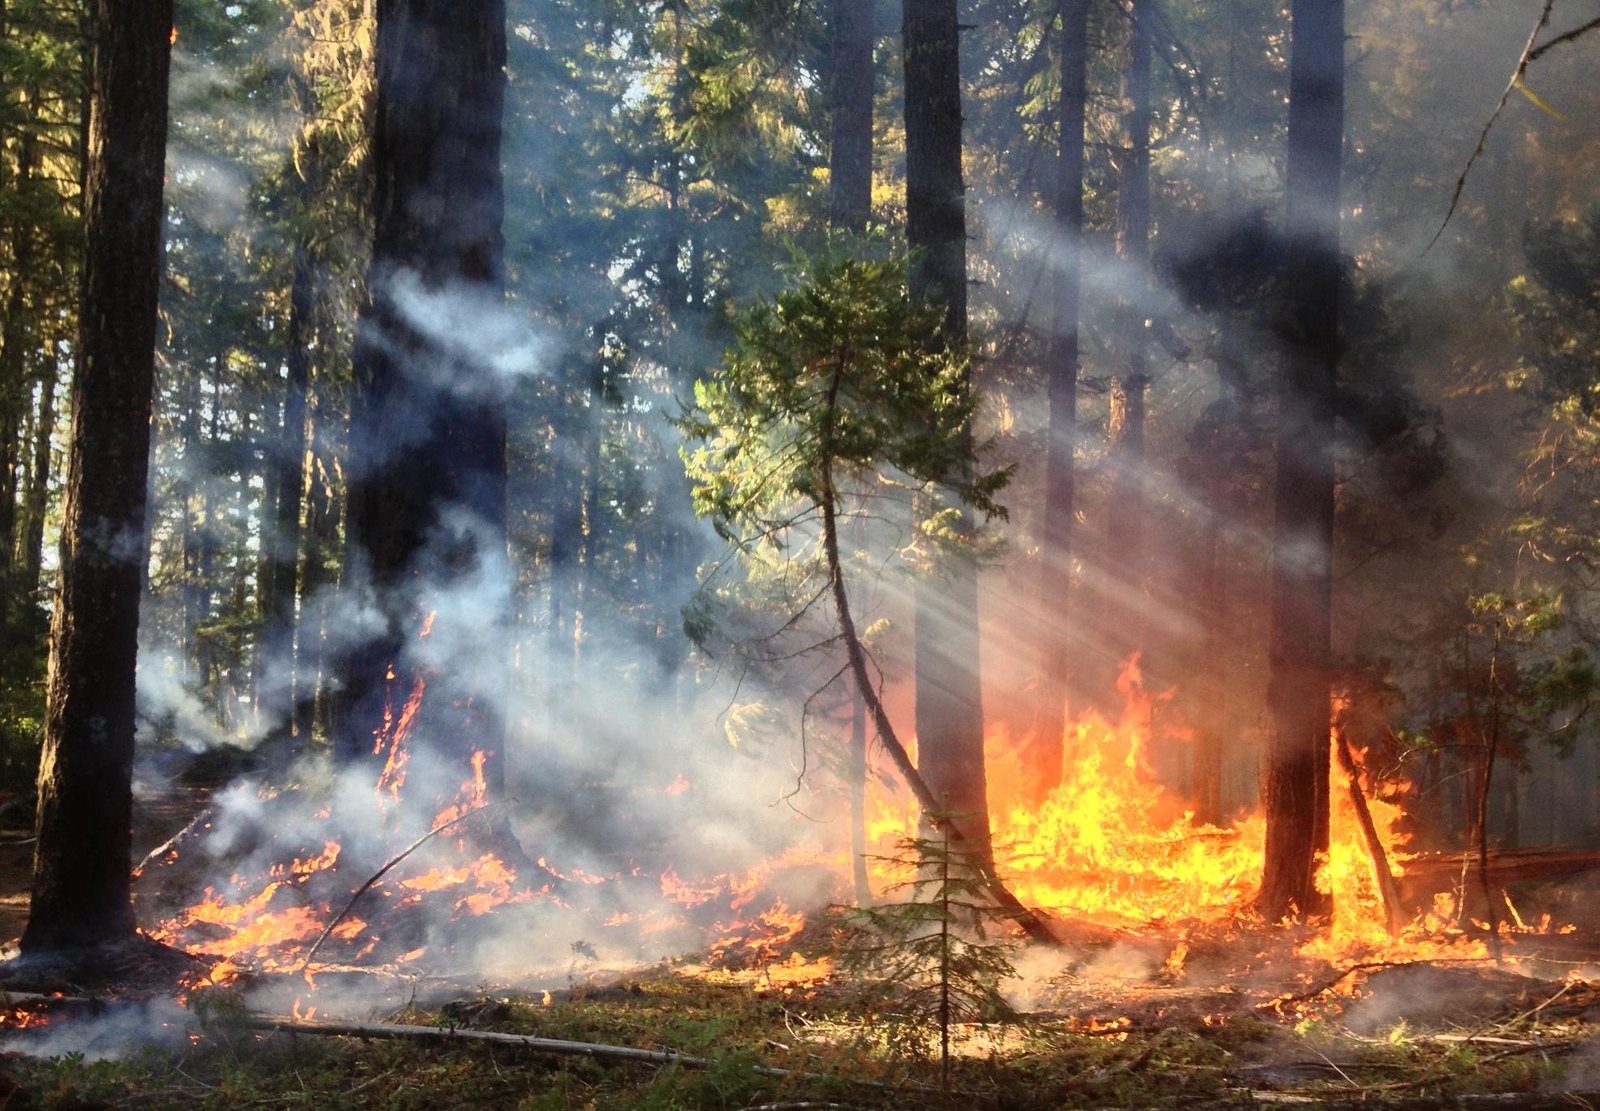
Sun streams through smoke at the Whiskey Complex Fire. The Whiskey Complex Fire in the Umpqua National Forest near Tiller, OR began by lightning on Jul. 26, 2013 by lighting has consumed approximately 17,894 acres and is 100% contained. Photo by J. Erwert.
-USDA
Spurred by the media attention surrounding fires burning in the Amazon, people are starting to wonder if this intense heat is a global trend. A first glance at the Global Forest Watch (GFW) Fires map shows an aggressive splash of fire alerts across the globe, giving the impression that half the world is on fire. Thankfully, that’s not the case. But how do we interpret the GFW data to know what’s normal and when we should be concerned?
Step 1: Understand what a fire alert indicates
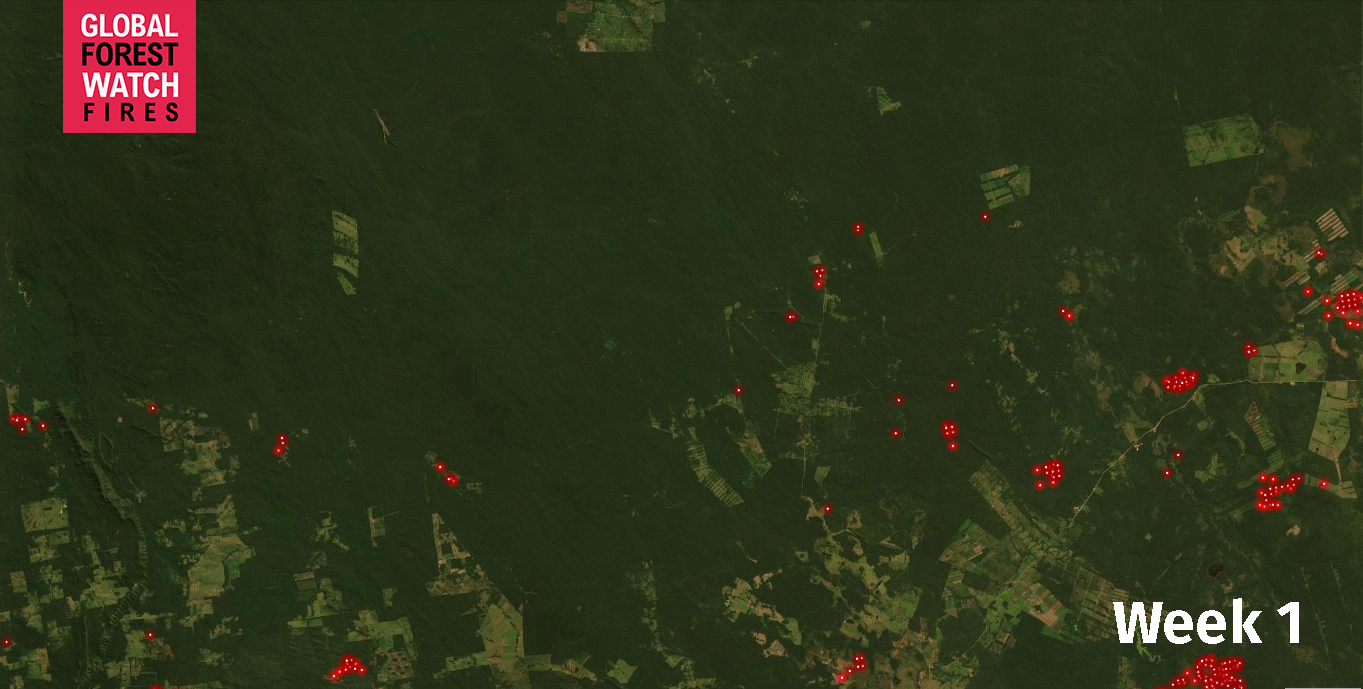
The quickest way to assess the fire situation in an area is to examine the number of alerts, which can provide a proxy for how many fires might be burning at a given time. But a fire alert doesn’t always mean there is a fire. An alert indicates that NASA satellites have detected a temperature anomaly of a big enough scale to register on the satellite’s sensor. A temperature anomaly could be caused by fires but can sometimes also result from extremely hot asphalt or the sun flashing off shipping containers. Other causes of inaccuracy include smoke or cloud cover, which may obscure a fire from detection by satellites, or double-counting a single fire as the satellite passes over in another rotation in its orbit. False alarm rates tend to go up as tree cover increases but never exceed a seven percent margin of error.
In addition, a single alert doesn’t indicate the size or intensity of a fire, only that in some part of that pixel a fire may be burning. Highly clustered alerts may indicate a larger, more continuous fire, but one must pay attention to the zoom level on the map. When zoomed out, alerts may appear more clustered than they are.
Step 2: Consider what’s “normal” for a given forest ecosystem
Fires can be a natural part of the ecology of dry forests and grasslands, helping clear debris and spur new growth. However, in humid tropical forests, natural fires are incredibly rare and more likely set by humans as a tool to clear land— to prevent vegetation from growing back over roads or to prepare land for agriculture. For example, in the DRC, home to 60 percent of the Congo Basin rainforest, there have been over 90,000 MODIS fire alerts and 397,000 VIIRS fire alerts in the month of August alone (see box for fire alert details). Yet the majority of these fires are burning in the southern portion of the country, in dry forest and grassland, rather than in the heart of the tropical rainforest. Any alerts detected in rainforest areas generally indicate human presence along roads, transport corridors like rivers and urban areas.
Bolivia has seen a rash of wildfires this summer in its Chiquitano Dry forests. Although low levels of fire disturbance do shape the ecosystem of these forests, their seasonal dryness leaves them highly vulnerable to out of control burning. Almost 800,000 hectares of the Chiquitano forests were burned in just one week in August— far more forest than typically burns in the country in two years— and experts estimate it will take almost 200 years for the ecosystem to fully regenerate. This sort of atypical burning in core forest areas should put the public on high alert.
 Fires in Santa Crúz, Bolivia between August 1 and September 4. The alerts detected fires originating around human activity, but quickly spreading into the core forest zone.
Step 3: Consider historical trends
Looking at trends in fire alerts over time can also help indicate whether current levels of alerts are normal for the region or not. Examining the DRC’s history of fires shows that 2019 is actually tracking with the average number of fires for the country in the past two decades.
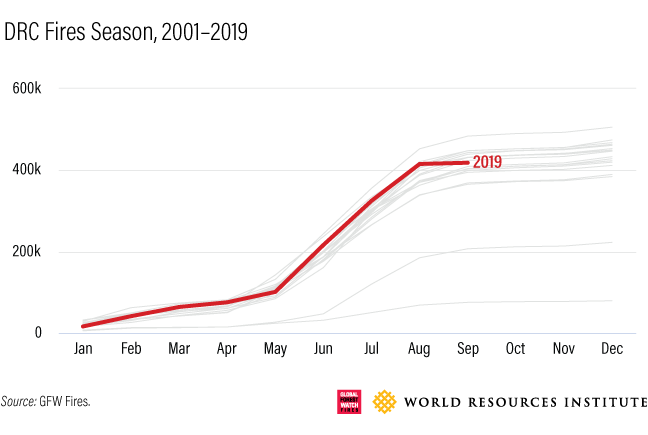 Data from NASA MODIS.
Angola, DRC’s neighbor to the south, however, has seen a higher number of fires this year than its typical average. As of August, 2019 was the leading year for fires since 2001. Alert numbers that are atypical compared to previous years, or are abnormally high given the time of year, can be an indicator that factors like drought and higher temperatures are impacting the region, or of increased human activity, and the situation should be carefully monitored.
Step 4: Consider the carbon value of the area
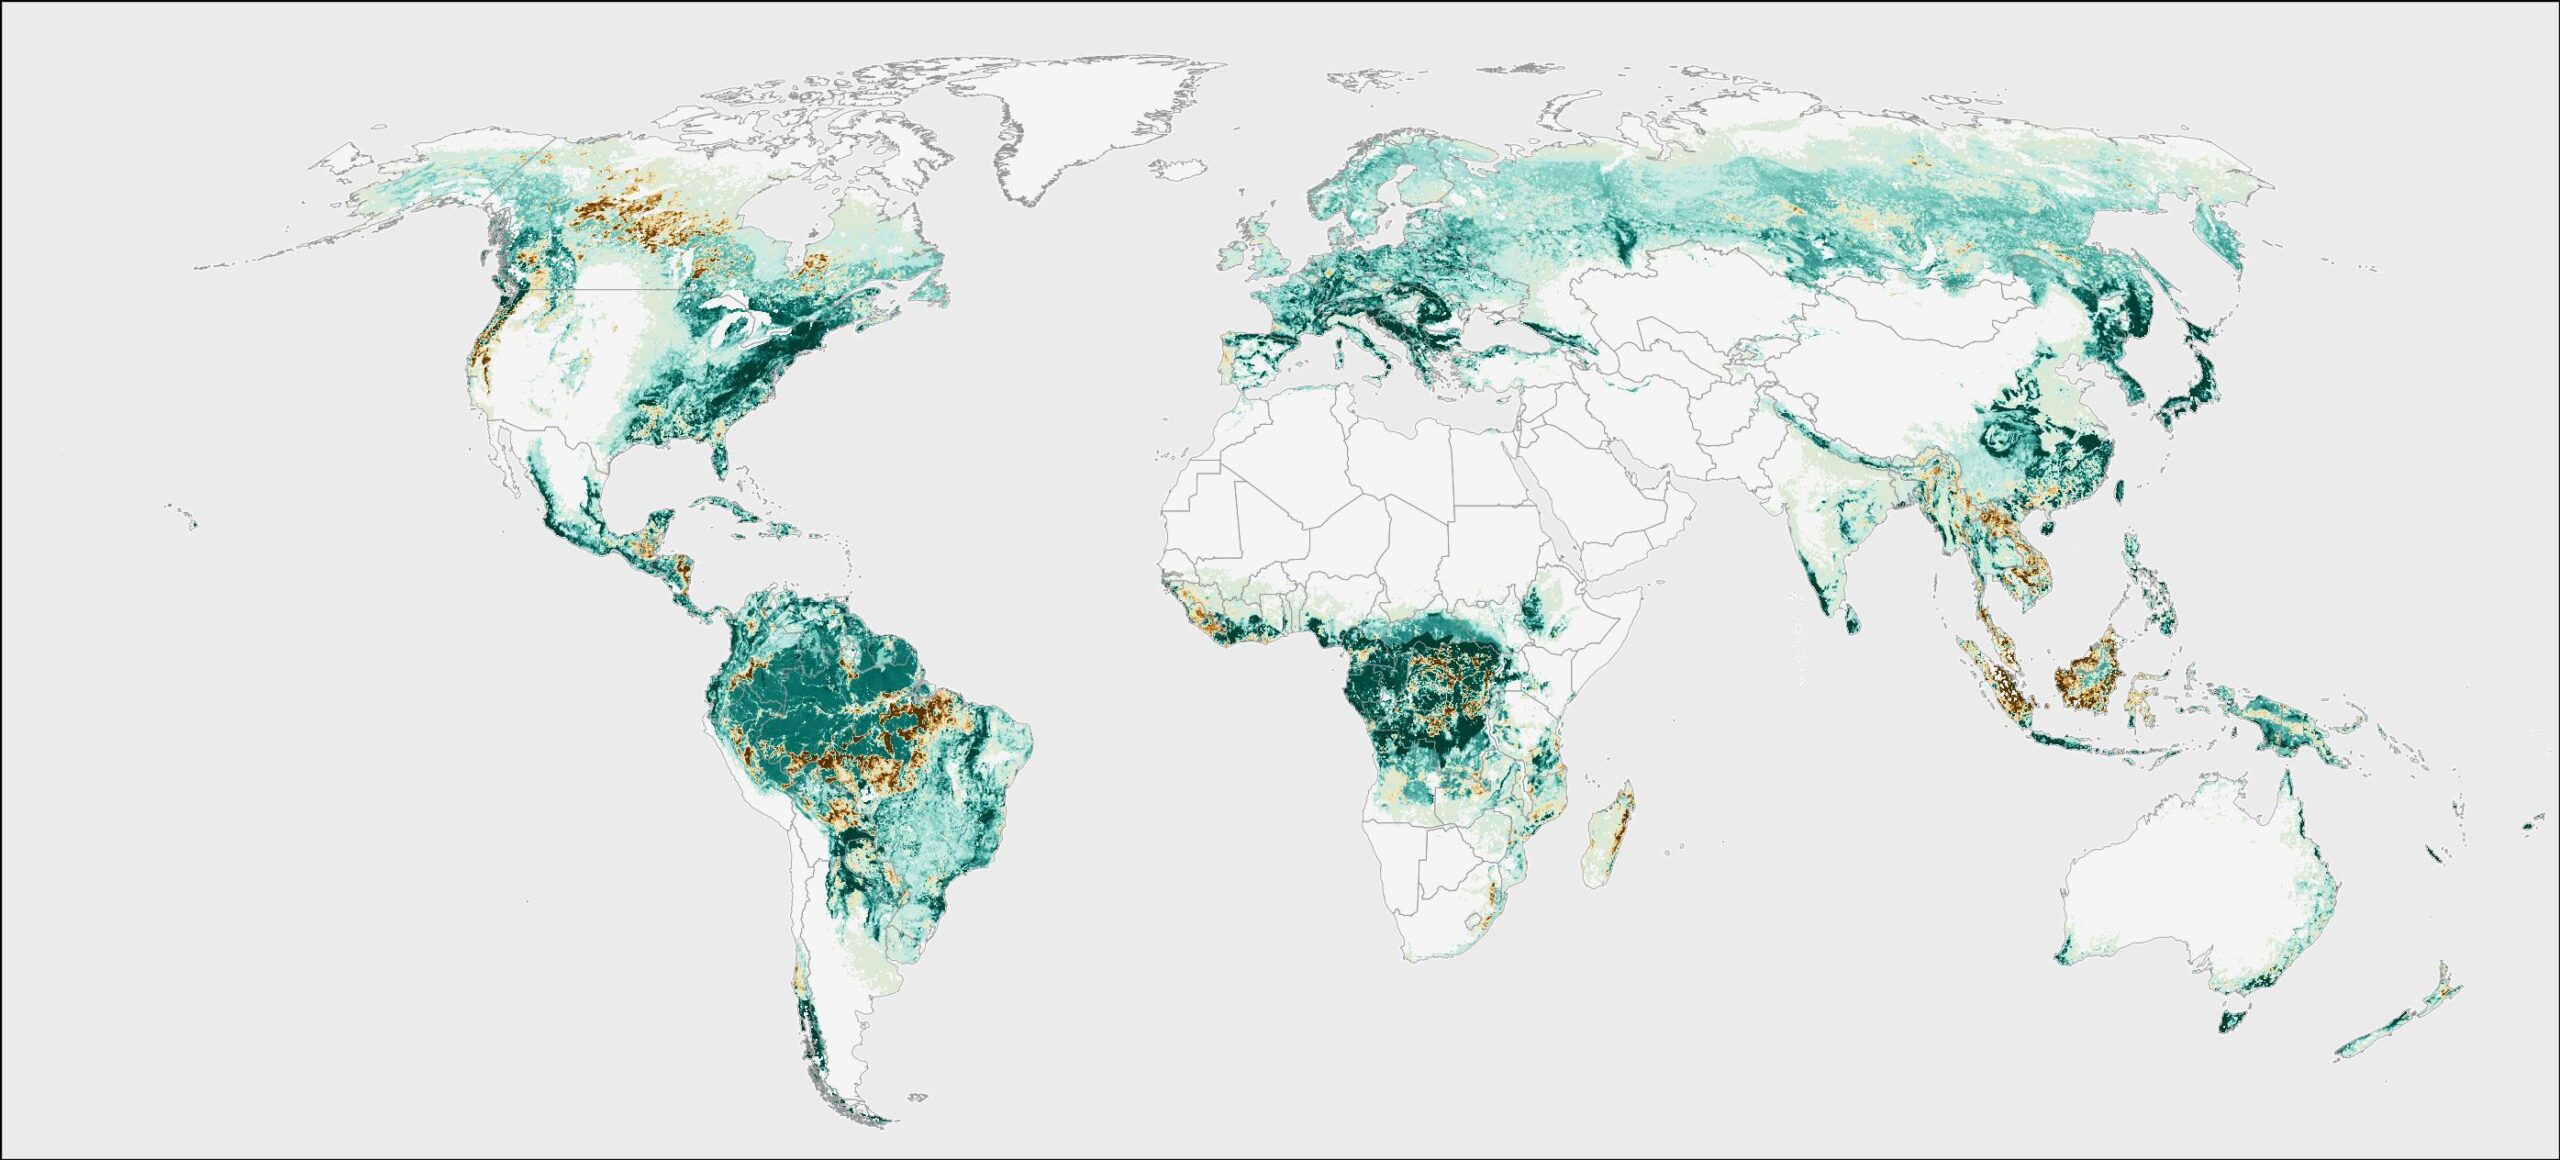
Another indicator that fires are a cause for serious concern is whether they are burning in areas of high carbon stock like peatlands and intact forest landscapes (IFL). Not only do fires release massive amounts of carbon emissions— Indonesian wildfires in 2015 released more emissions daily than the US economy— but extremely intense fires can inhibit quick forest regeneration, reducing the potential future carbon sequestration.
IFLs absorb one fifth of human caused emissions each year. Many boreal IFLs are also located atop permafrost, a type of permanently frozen soil that some scientists estimate store more carbon than the amount currently in the atmosphere today. Forest fires threaten to melt this important carbon store, releasing massive amounts of carbon into the atmosphere.
The state of Alaska, containing the most IFLs in the United States and large areas of permafrost, has suffered an abnormal uptick in fires alerts between May and July of this year. In August, the massive McKinley Fire burned through 1,740 hectares between Anchorage and Fairbanks. Since May, nearly three quarters of all the fire alerts picked up in Alaska were detected in intact forest landscapes. Increased burning in these carbon-critical areas should set alarm bells ringing.
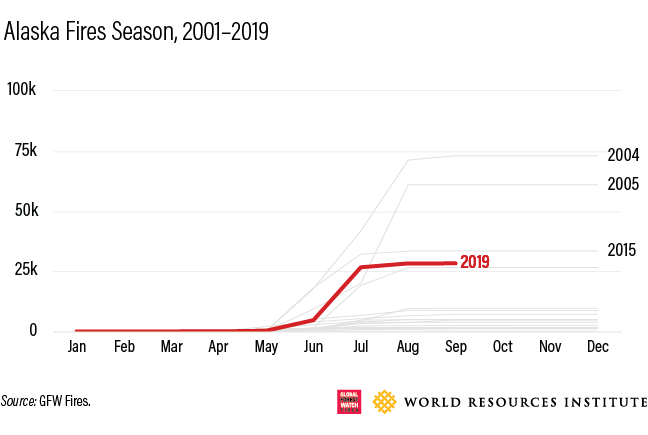 Data from NASA MODIS.
Peatlands also store large amounts of carbon within their soils. The heightened emissions from Indonesia in 2015 were in part due to the high proportion of fires burning on peatlands, exacerbated by El Niño droughts. Since the beginning of 2019, another El Niño year, about one third of Indonesia’s fires have been on peatlands.
2019 fires and beyond
Globally, the fires we’re seeing this year are not so far outside of average, but some smaller regions are beginning to see alarming new trends. With increasing global temperatures, forests around the world are becoming more and more susceptible to fires. Whether natural or human-caused, fires will increase in frequency and intensity in a hotter, drier climate, creating a feedback loop for more fires and an even hotter and drier climate if nothing is done. Continuing to investigate fire data and monitor active fire alerts will only become more important in the years to come.