The First Step of Transforming Indonesia’s Peatland Governance: Know Where the Peat Is
At the 23rd COP meeting in Bonn in November, Indonesia Minister of Environment and Forestry (MoEF) Siti Nurbaya said the world learned about peat governance from Indonesia. As the center of the world’s attention, Indonesia has to step up its actions to ensure that healthy peatlands can be protected and degraded peatlands can be restored. However, we cannot do either without knowing the location, type, extent and depth of Indonesia’s peat, the causes of the degradation, and their hydrological conditions. Therefore, the first step in the process of managing peatland is mapping it. Government, private sector and researchers use several different techniques depending on what information they want to collect.
Light Detection and Ranging (LiDAR)
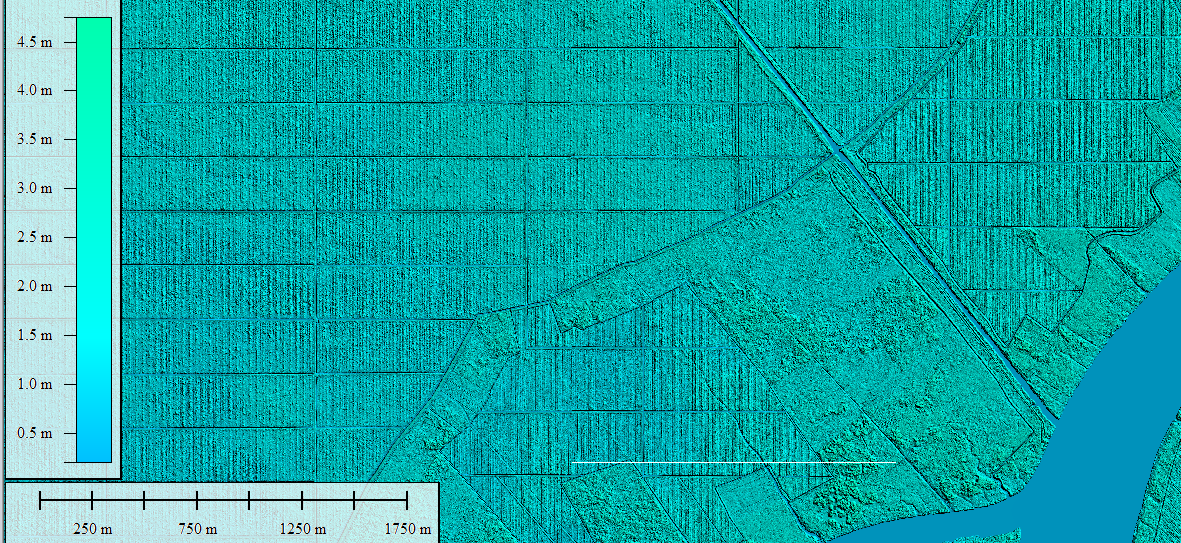
LiDAR is a remote sensing method that uses lasers to measure the distance from a LiDAR sensor to an object on the Earth’s surface. This method produces highly detailed maps that show peat’s surface elevation and water flow.
 Surface elevation and drainage mapped using LiDAR help determine water flow in peatlands. Photo by Peatland Restoration Agency.
Surface elevation can help determine the depth of peatland. Peatland that is higher than its surroundings is indicative of soil accumulation, which is important because the deeper the peat, the more carbon it stores. Dome-shaped peat is some of the deepest, usually measuring at least 300 centimeters (118 inches). By locating peat domes, we can prioritize conserving them and the carbon they store. Meanwhile, waterflow patterns can identify and locate drainage canals, which are commonly used to dry out peatlands before burning and converting to agricultural use. Even when it’s not burned, drained peatland is a major source of emissions due to the carbon released when microbes begin decomposing the organic matter within the soil. Locating these canals allows restoration efforts to more efficiently block drainage, raise peatland water tables and prevent emissions. LiDAR-equipped planes can also carry optic cameras that take aerial photos, which can be used to map where peatland is forested, degraded, burned or developed for agriculture. In Indonesia, LiDAR is currently mostly used for peatland restoration. The Peatland Restoration Agency (BRG), in cooperation with Geospatial Information Agency (BIG), Gadjah Mada University, mapping companies and other related ministries, used LiDAR to map drained peatland. They used this information to restore four peatland hydrological units—areas that are bordered by rivers or other bodies of water and have important ecological properties—throughout South Sumatra, Central Kalimantan and Riau.
Satellite Images
Satellite images are used to distinguish peatland from other land types based on colors, patterns in vegetation and water extent. The Ministry of Agriculture combined satellite images with other spatial data on peatland, including historical peat extent maps and peat thickness survey data, to map Indonesia’s peatlands in the scale of 1:250,000 (1 centimeter on the map is equivalent to 2.5 kilometers on the ground). This method is most useful for national-scale planning, such as developing the national forest moratorium map, as it shows large forests and concessions.
Coring
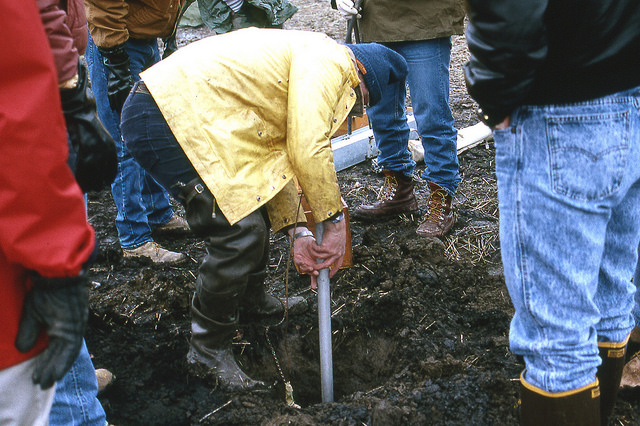 Researchers take a core sample. Photo by James St. John.
Coring, which involves driving a hollow tube into the ground to collect soil samples from different depths, is mainly used to measure peat thickness and gather information on the physical and chemical properties of the soil. The MoEF, BRG and local universities have been using this method to map peat thickness and characteristics such as acidity level and bulk density, which are then used to determine protection and utilization areas. This method is time- and labor-intensive, especially in large areas, and therefore usually used in combination with LiDAR and satellite images.
A better way to map peat
These mapping techniques are just the beginning. There is potential for innovative technologies and methods to make peatland mapping more accurate, affordable, efficient and scalable. The Indonesian Peat Prize, hosted by the Geospatial Information Agency, is a competition to do just that. Prize participants used technologies ranging from electromagnetics to machine-learning and radar. Peatland mapping technologies and methodologies are improving all the time, and with them our ability to sustainably manage peatland. Getting the accurate data and information is the first key step to enabling Indonesia to meet its peatland restoration and protection target.
