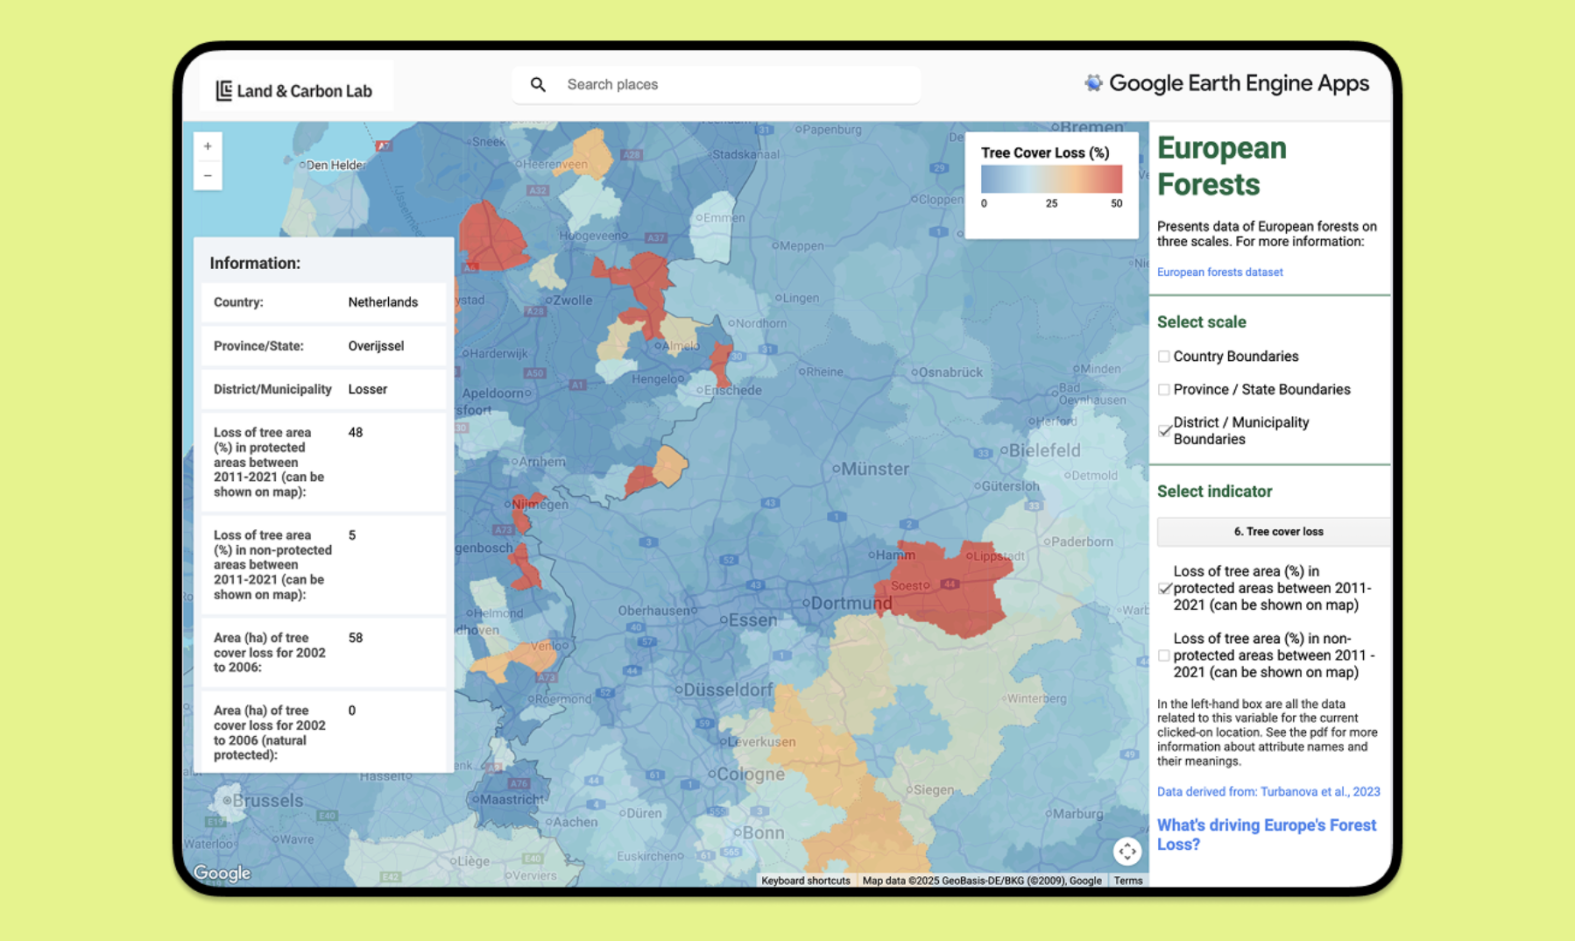
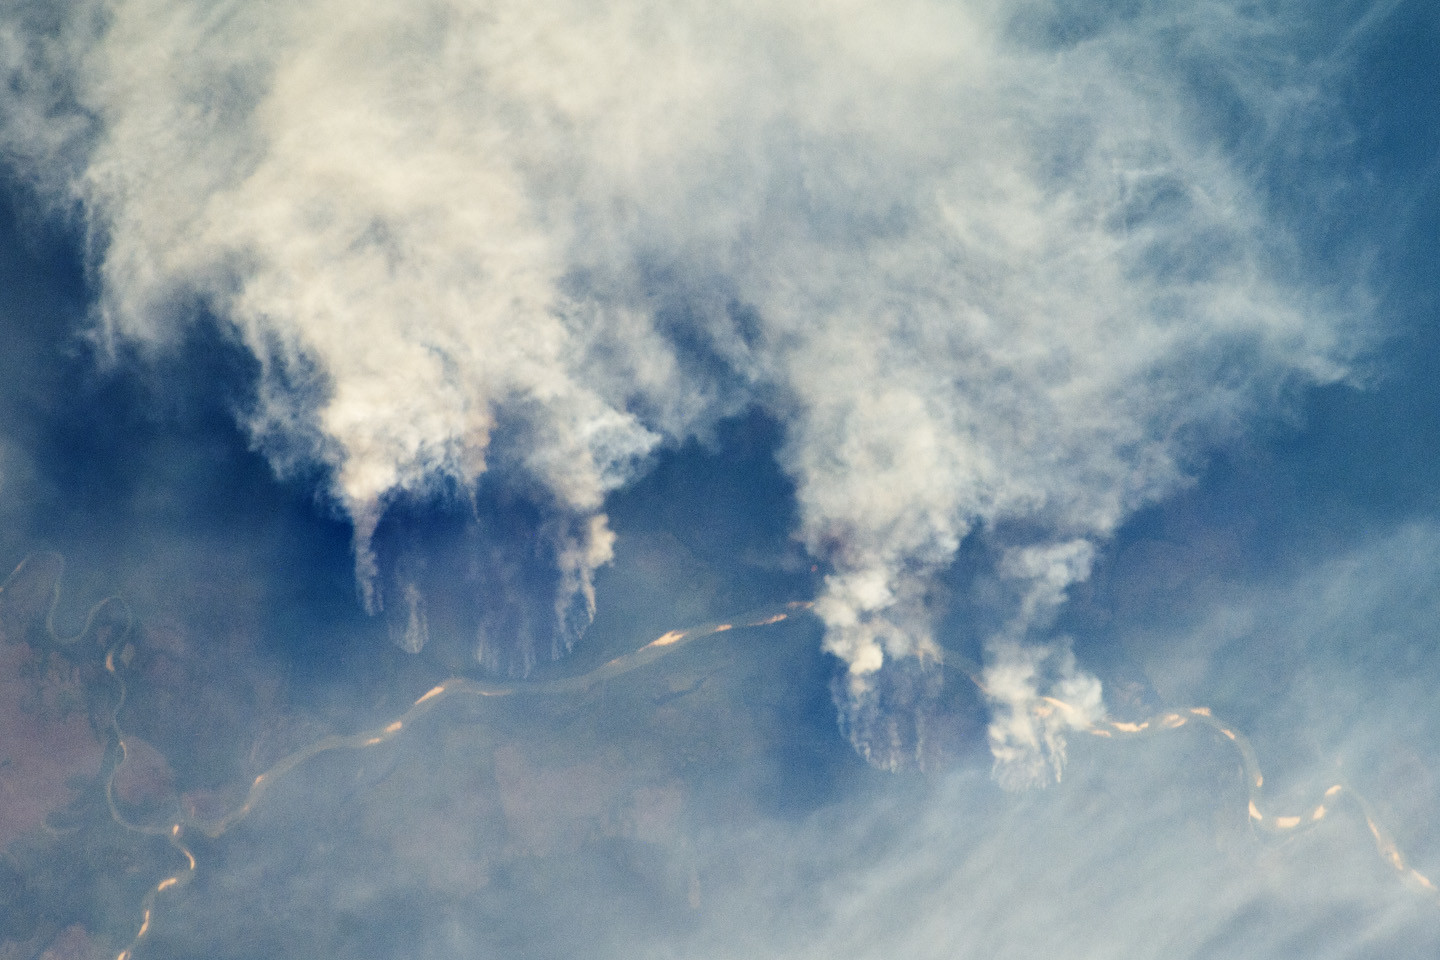
New data shows alarming increases in primary forest loss in 2024. What does the data measure and how does it compare to other official data?
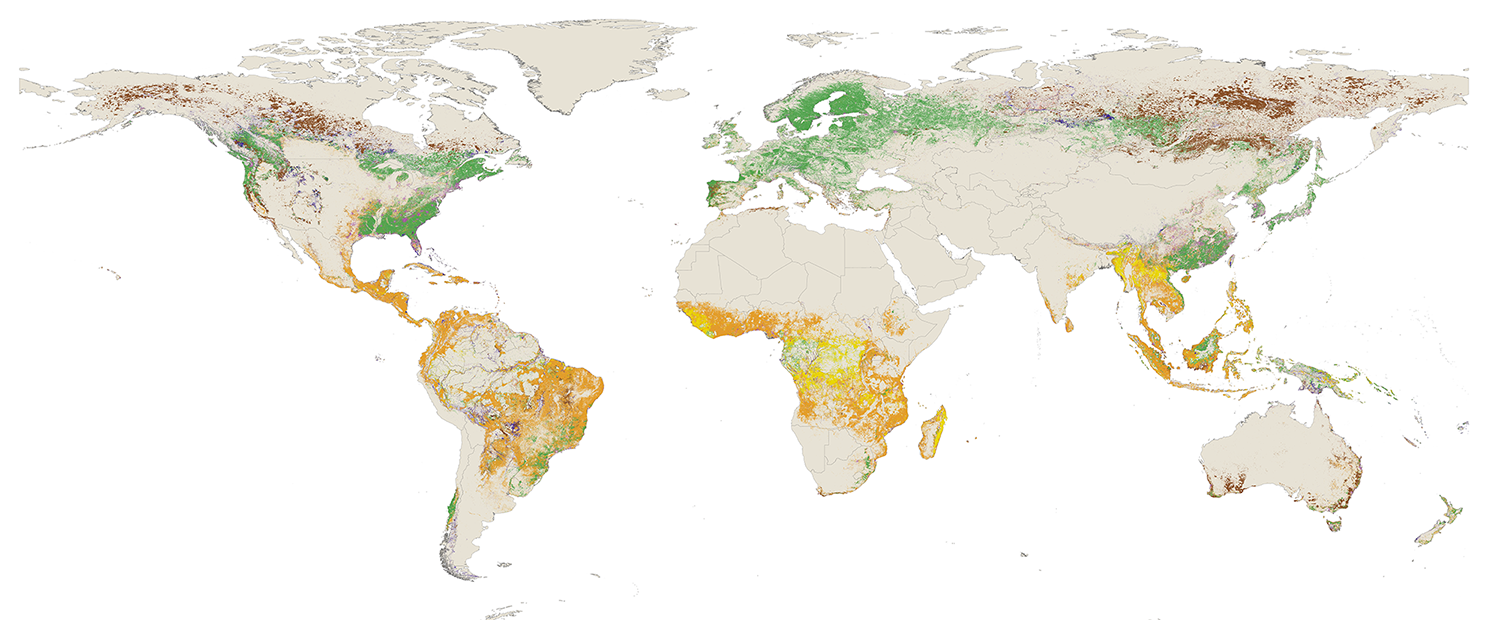
New data on GFW shows drivers of tree cover loss at 1-kilometer resolution, providing the most detailed view of drivers yet.
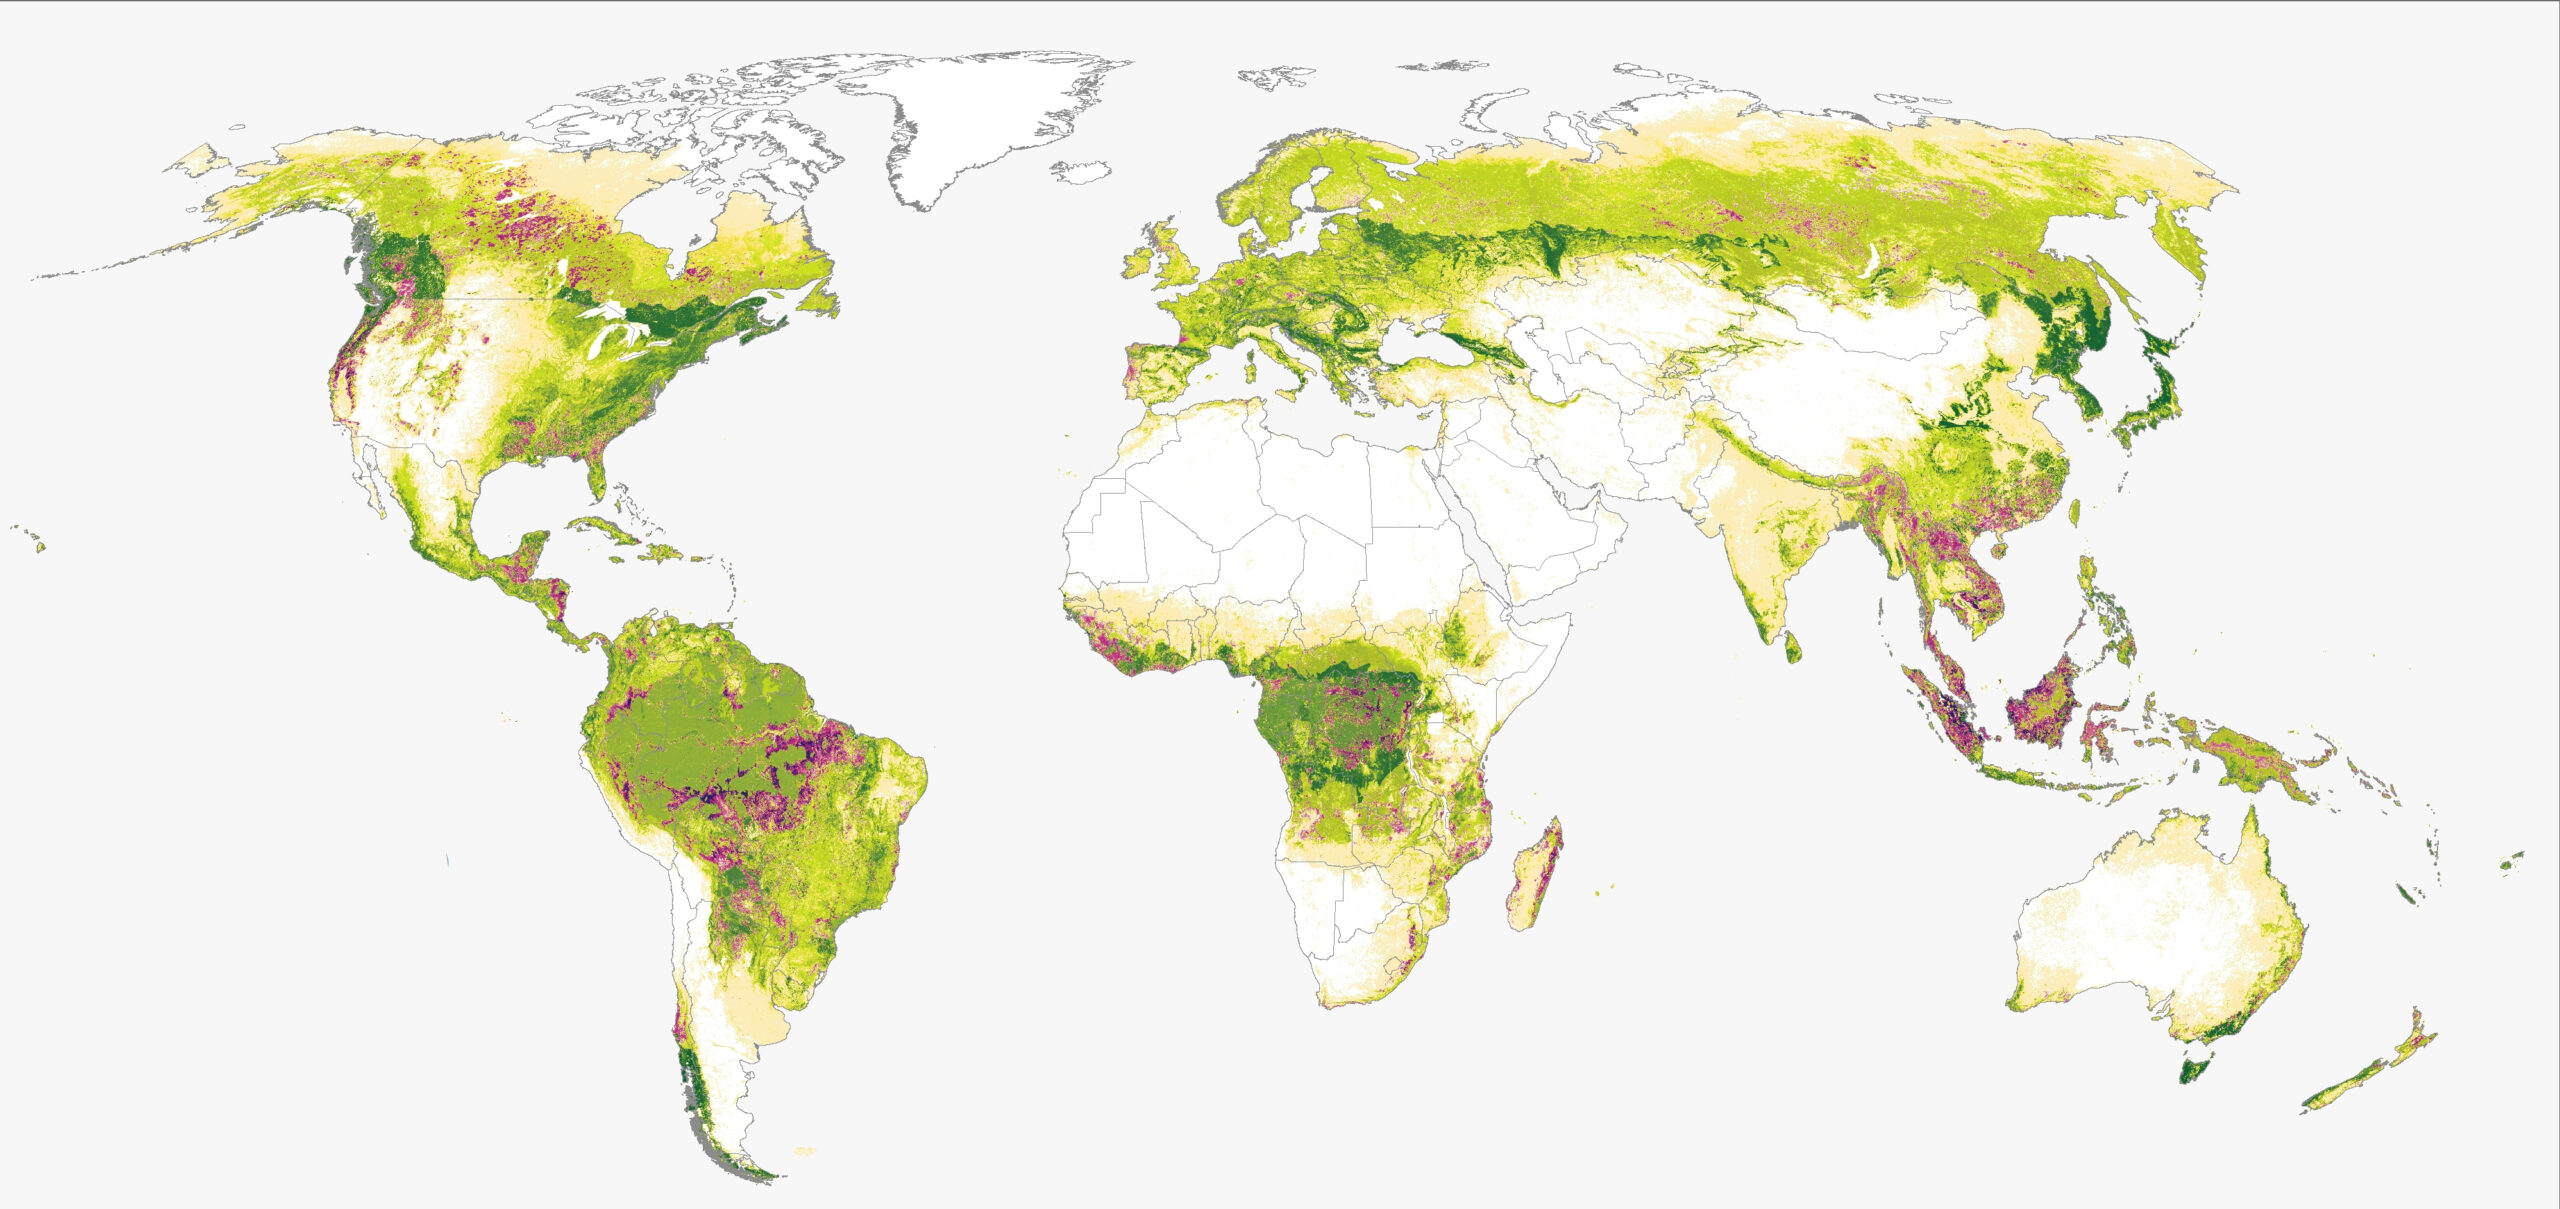
Carbon monitoring data on GFW provides information on where forests are gaining or losing carbon. We updated the model in 2023 and 2024.
fetching comments...