Assessing Trends in Tree Cover Loss Over 20 Years of Data
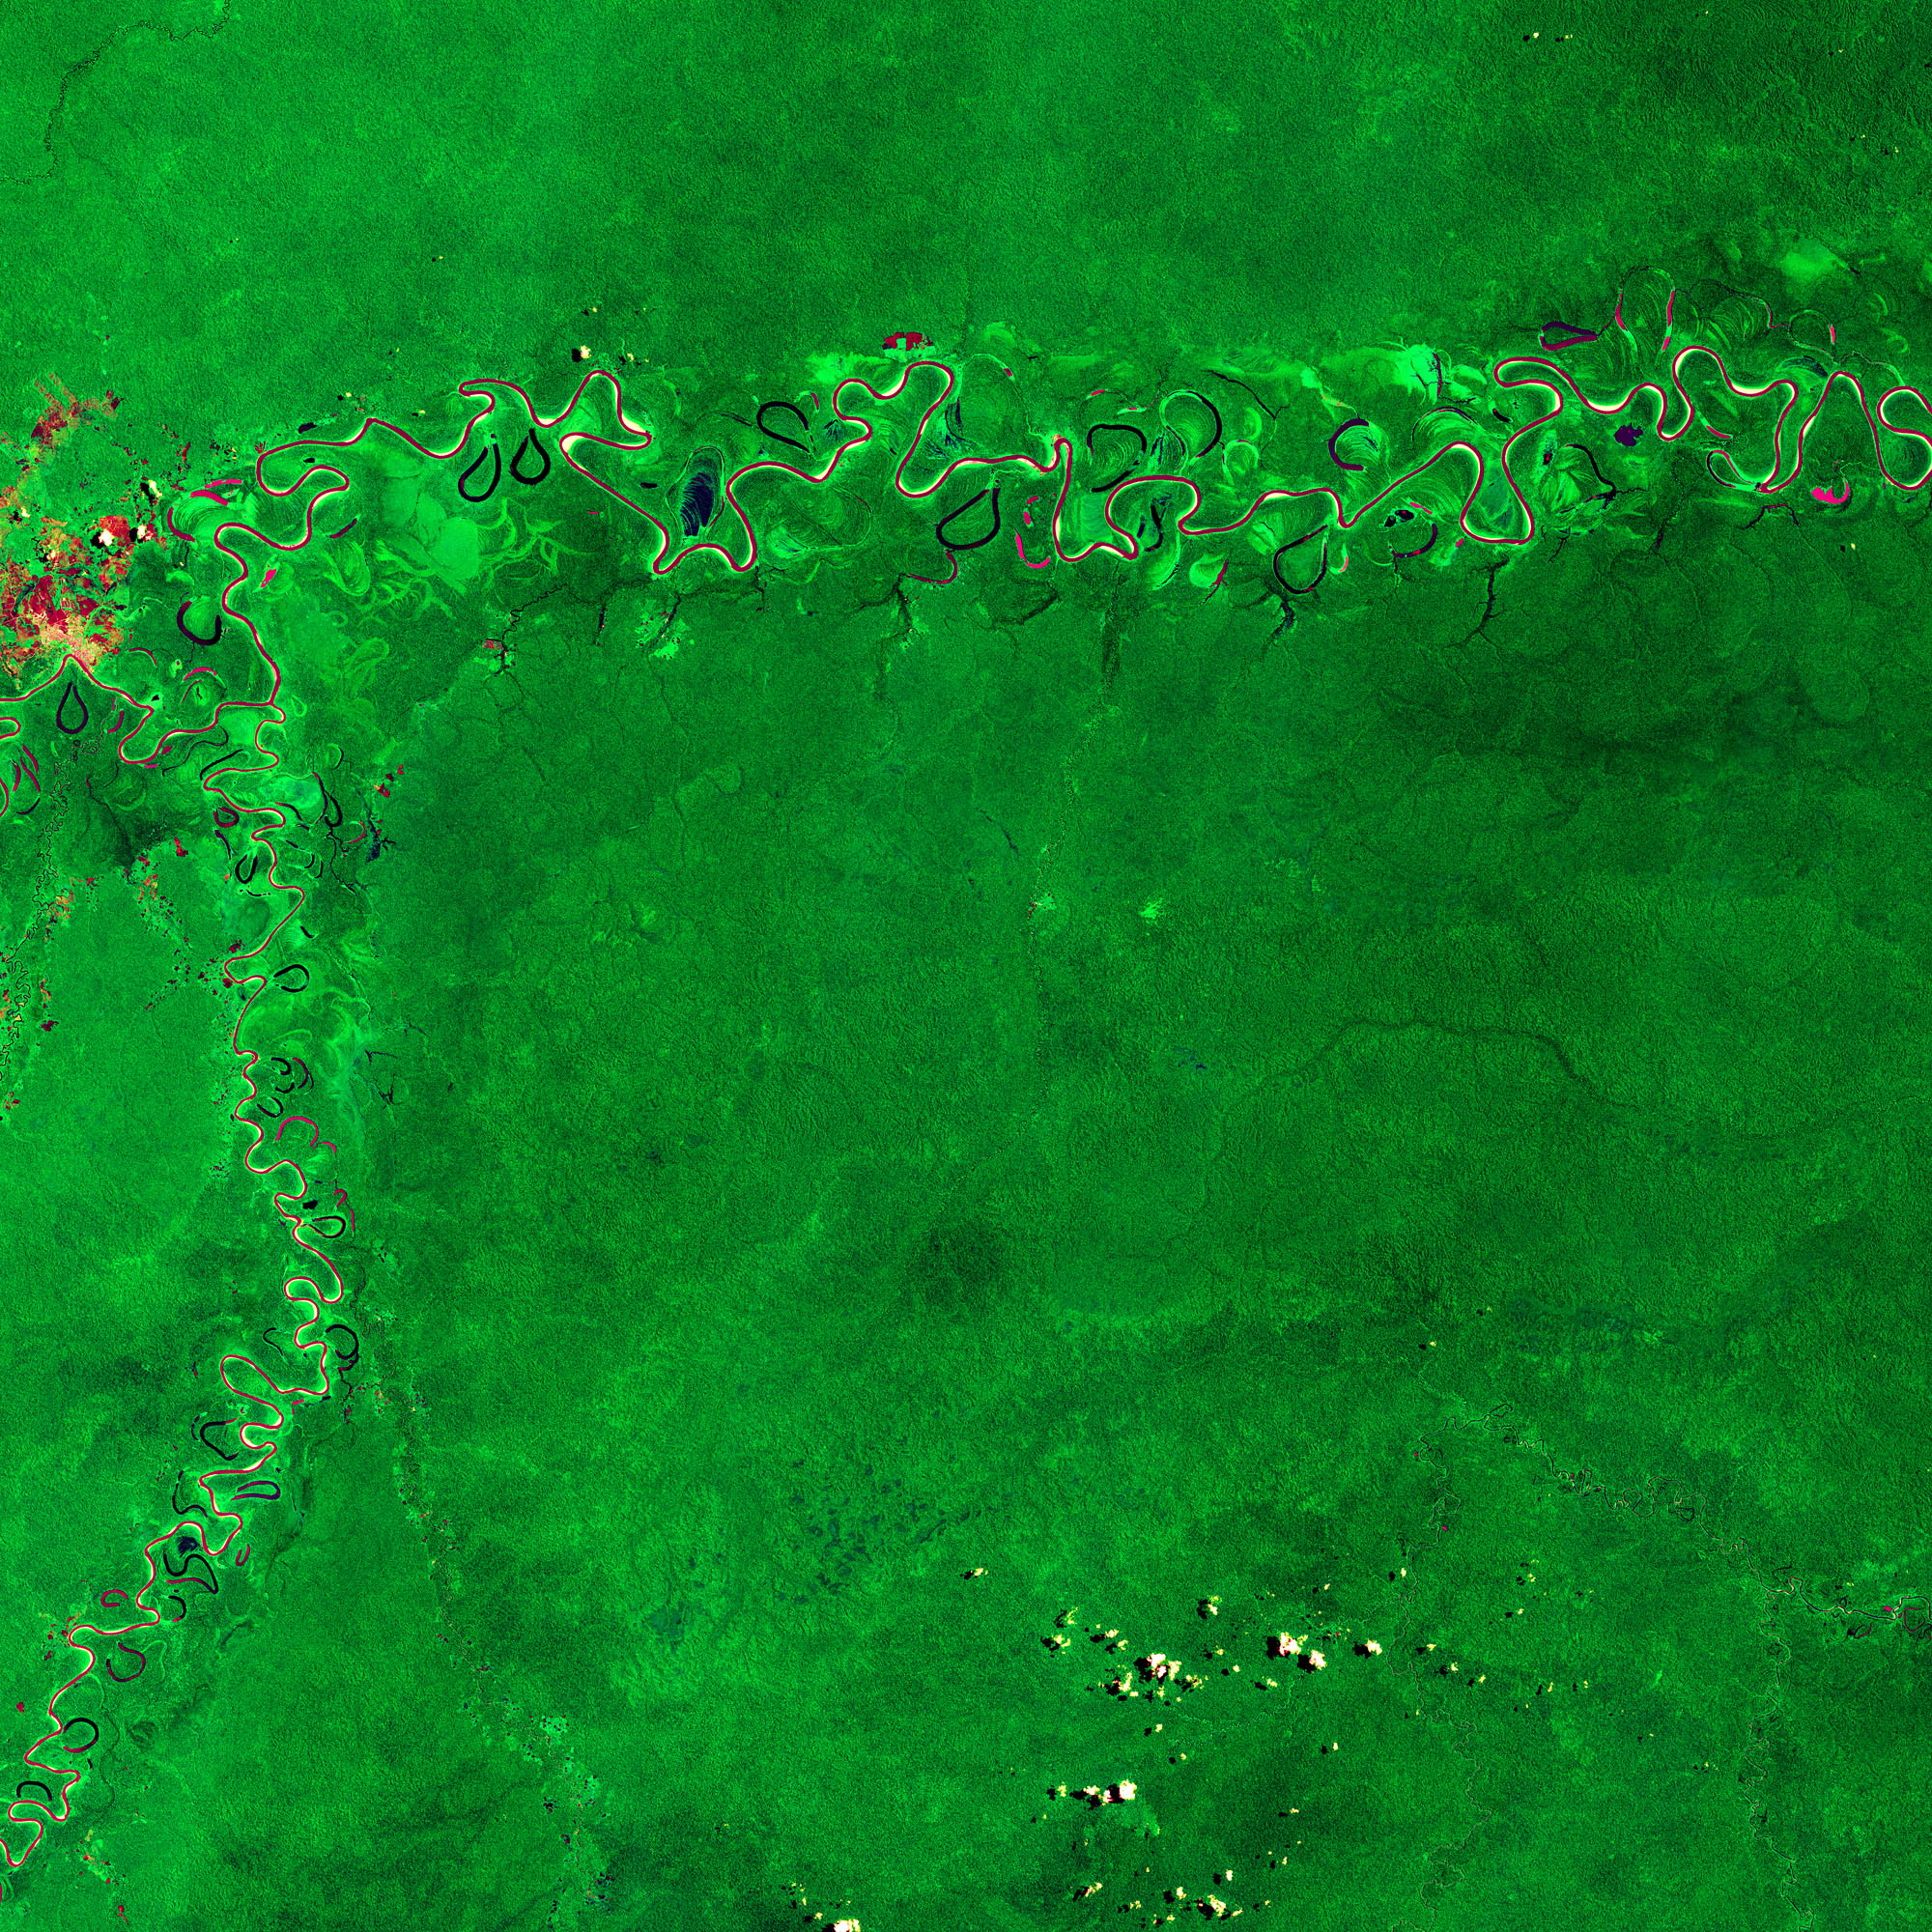
Amazon Rainforest as seen from satellite imagery. ESA/Flickr
The tree cover loss data from Hansen et al. 2013, featured on Global Forest Watch, represents the best available spatial data on how forests are changing around the world. It is unparalleled in its global coverage, multidecadal time span, annual update frequency and 30-meter pixel resolution. As such, it is a powerful tool for mapping recent tree cover loss and has been widely used by governments, academia, private sector and civil society alike to identify and address deforestation.
The data remains so widely used in part because it continues to improve as relevant methods and technologies evolve. Here we describe the changes to the data over time, explore the implications for how this data should be interpreted and used, and offer a glimpse of our plans to improve the consistency of this data in the future.
How and why has the tree cover loss data changed over time?
There are a few factors that cause inconsistencies in the data over its 20-year span (read more on the UMD download page):
- Algorithm adjustments: The original algorithm used to map tree cover loss from satellite images for 2001-2012 has been improved upon in subsequent updates. These improvements allowed for annual updates starting in 2013 (coupled with small additions to the 2011 and 2012 data) and have resulted in enhanced detection of loss— particularly from 2015 onwards.
- Improved satellite data: The algorithm uses every available Landsat image (from the Landsat 5, 7 and, since 2013, Landsat 8 satellites) to detect tree cover loss. The Landsat 8 satellite has the same resolution as previous Landsat missions, but has an improved sensor that can better resolve features on the ground. Incorporation of Landsat 8 data into the loss algorithm resulted in better detections of tree cover loss smaller than an individual pixel (e.g. selective logging) starting in 2013.
- Variations in satellite image availability: The number of Landsat images available per year has generally increased over time, allowing us more opportunities to “see” changes on the ground. The number of images in 2012 was particularly low given the gap between the decommissioning of Landsat 5 in 2011 and the launch of Landsat 8 in 2013. Clouds and smoke can also delay the detection of tree cover loss if there are no clear images available between when the tree cover loss event happened and the end of the year. This is particularly relevant in the case of late-year fires, which are often not detected until the following calendar year.
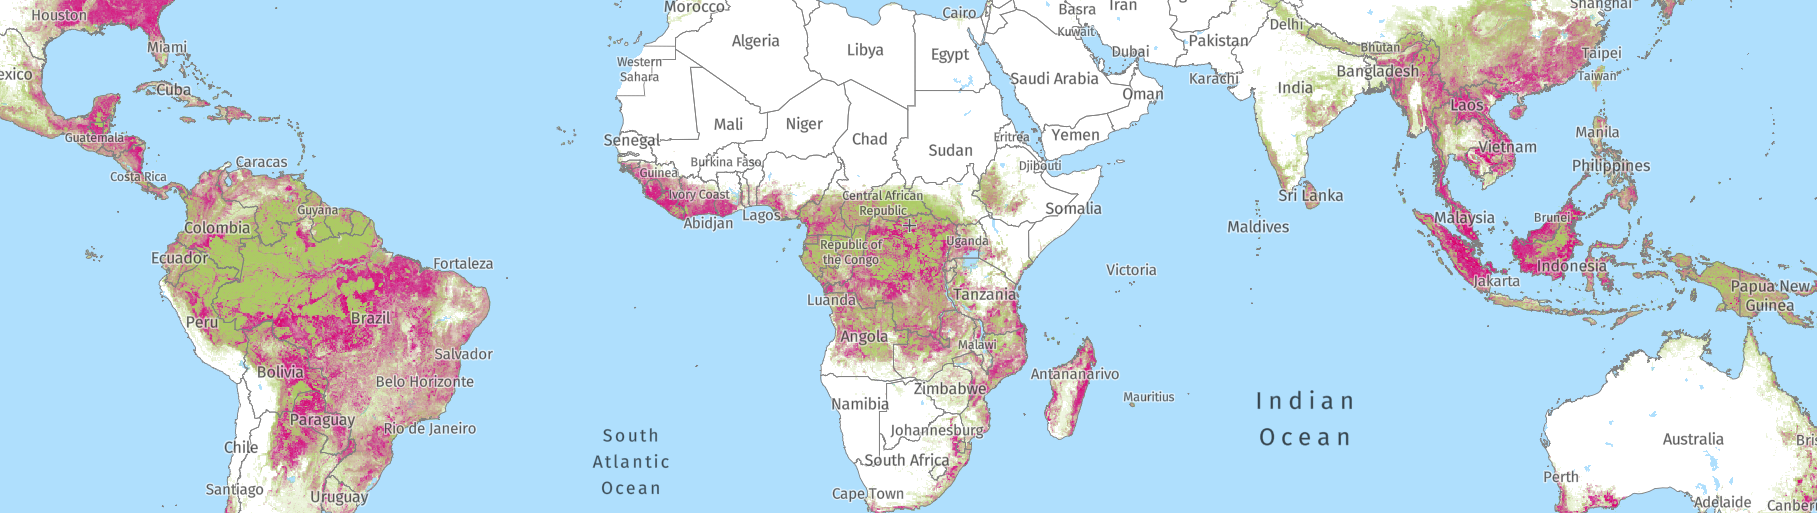
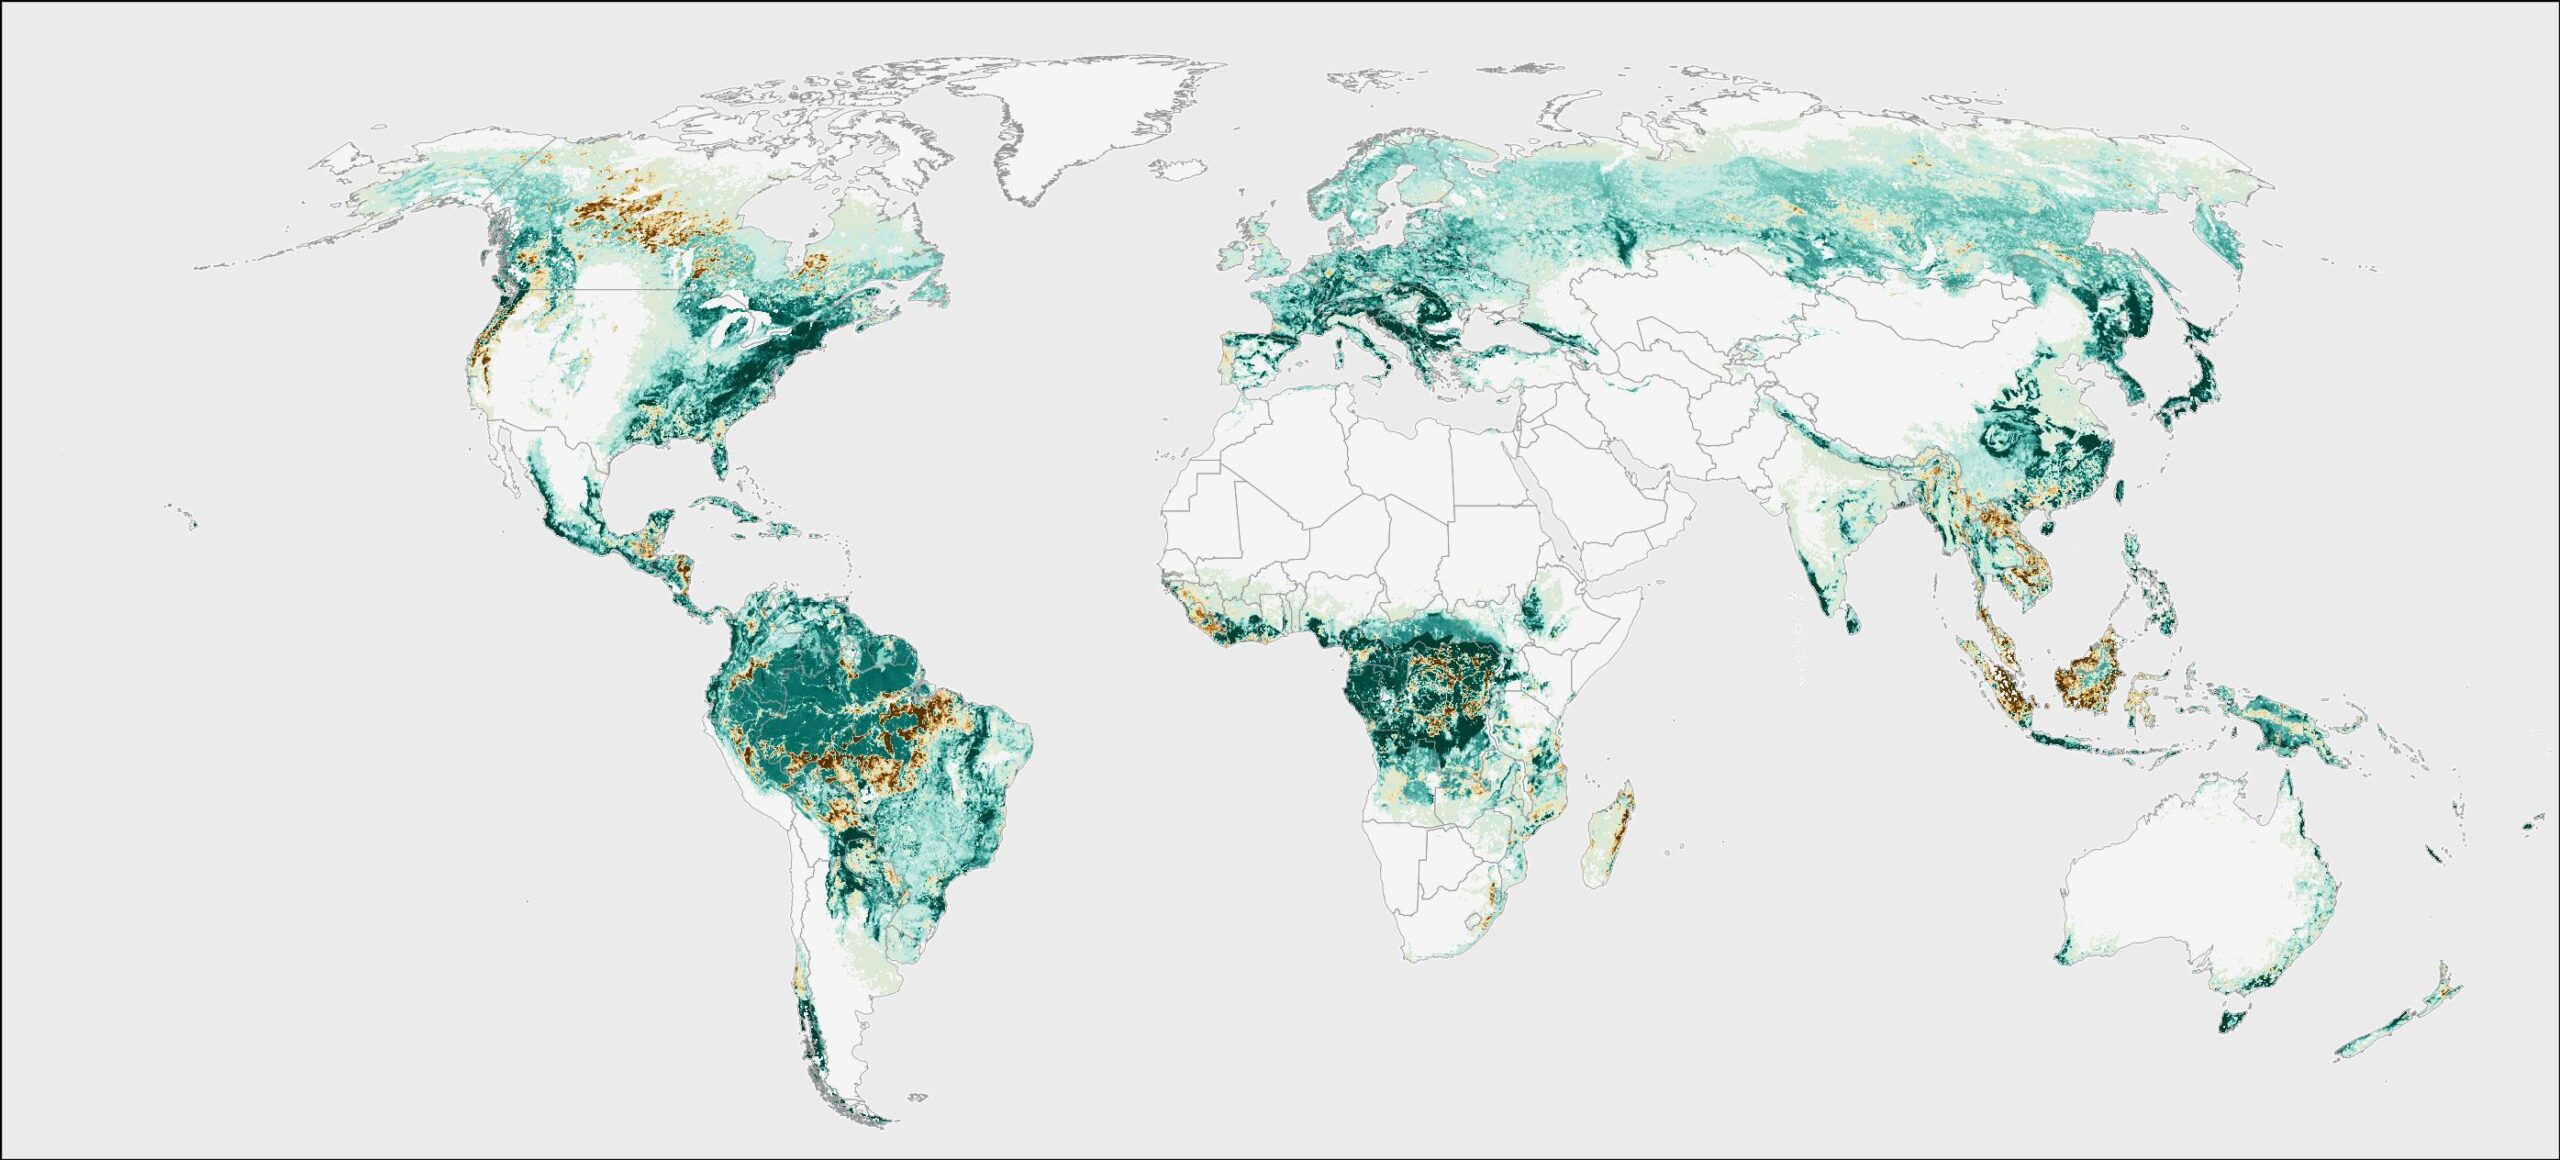
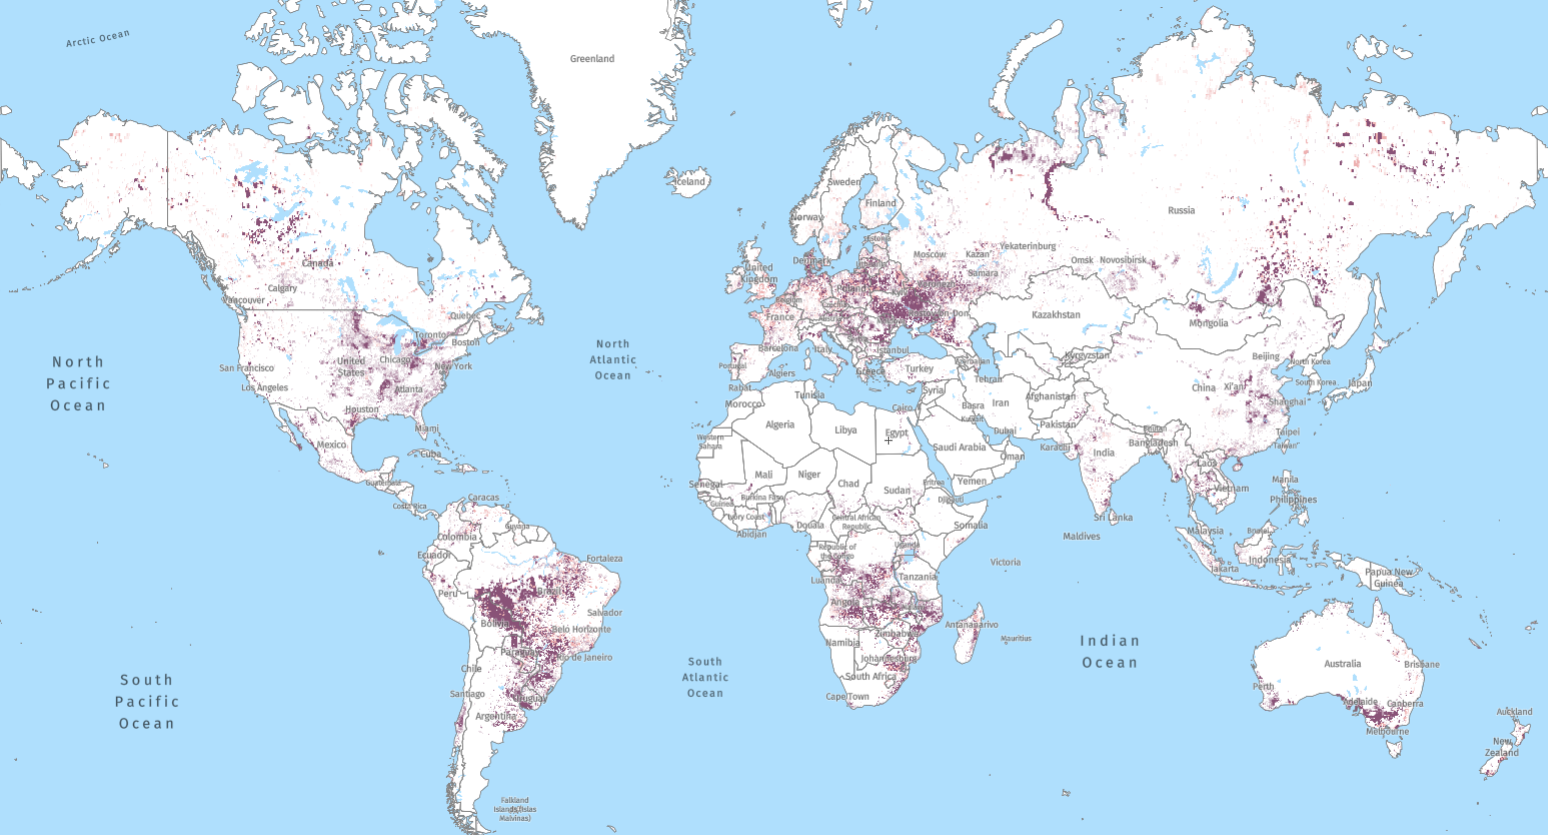
In general, the first two factors have resulted in increased sensitivity in detecting tree cover loss, giving us a better understanding of changes that are typically difficult to map, including fires, selective logging and shifting agriculture. Certain areas benefitted more than others from these improvements— the Brazilian Amazon and Indonesia are dominated by large-scale clearing and so loss was already well captured by the initial algorithm, while West and Central Africa, Southeast Asia, and other areas with smaller-scale forest clearing were more affected by the improvements. In European and North American temperate forests, the improved forest loss data after the year 2015 is more sensitive to selective logging. Surface fires that partially degrade the tree canopy are also detected better in the recent data compared to the 2000-2012 original product.
The tradeoff for improved loss detection is the introduction of inconsistencies into the time series. To some extent, this is inevitable – science and data improve over time, and it’s not always possible or desirable to maintain 100% consistency. As an example, consider COVID-19 case numbers: testing is more available and well understood than it was in early 2020, but that doesn’t mean that case counts from early in the pandemic are useless.
How can the data be used to analyze trends?
The most robust way to analyze loss trends for a specific area and time period of interest is to perform a sampling exercise using appropriate statistical models. The tree cover loss map can be used to identify where change likely happened each year, and a sample of points within and outside such areas can be inspected using Landsat time-series data (e.g., analysis ready data provided by the UMD GLAD lab) and high resolution imagery. The reference data collected through such an exercise can be used to develop an unbiased estimate of the area of tree cover loss that occurred, as well as a measure of uncertainty around the estimate. These sample-based estimates are independent of the method changes in the mapped data.
However, that approach is not feasible to implement for every project or analysis when considering the needs for timeliness, the number of areas to assess, or budget. Here are some tips to keep in mind when using the tree cover loss data directly to assess trends:
- There have been minimal changes to the method and satellite data after the year 2015, so analysis of the recent past is less likely to include temporal inconsistencies.
- Use 3-year moving averages to smooth any inconsistencies between years caused by the availability of Landsat images and better account for delays in detection of late-year fires and other losses.
- When comparing time periods such as before or after 2011, or before and after 2015, be conscious that you’re comparing across model changes.
- Apply caution when assessing the trend over time in areas more likely to be impacted by the changes (e.g. Central Africa), and note any changes in the trend aligning with the timing of the method changes (e.g. a large uptick starting in 2013 that may align with the incorporation of Landsat 8).
- Contact the GFW or UMD team if you have questions about model performance change for a particular region.
Do the changes impact other uses of the data?
For those using the tree cover loss map to understand where forest loss is happening, there is no impact. The model changes have impacted the sensitivity of the data to detect tree cover loss, so we should be capturing change even more comprehensively than before.
For those calculating area statistics for a given year but not comparing over time, there is not a big impact. The data can be used to give a relative indication of the extent of tree cover loss across different geographies.
What changes will impact tree cover loss data going forward?
The University of Maryland and GFW are working on an updated version of the tree cover loss algorithm to apply from 2001 onward, thus providing a more consistent record of loss over the entire time series. This “version 2.0” of the data will not only improve detection of loss in earlier years but will also allow us to detect multiple losses in the same pixel over time (e.g., in places where cyclical agriculture or forestry is happening) and distinguish areas of complete canopy removal from partial disturbances (e.g., from selective logging or understory fires).
The “version 2.0” will resolve the inconsistencies in the data related to the algorithm – however, improved satellite data and image availability will always be a factor that causes variation in the detail of detection. Landsat 8 has delivered constant quality and quantity since its launch in 2013, something that will hopefully be continued with the launch of Landsat 9, scheduled for late 2021.
However, as satellite data and methods continue to improve, it’s likely there will always be trade-offs between detecting current change as well as possible and ensuring consistency over time.
The tree cover loss data remains one of the best sources of information on forests out there due to its coverage, spatial resolution, and regular updates. Being aware of the caveats and changes to the data over time helps ensure that we’re properly taking advantage of this valuable resource.