Looking for the Quickest Signal of Deforestation or Vegetation Disturbance Globally? Turn to GFW’s Integrated Disturbance Alerts
Global Forest Watch (GFW) provides near-real-time information on where vegetation disturbances are happening around the world. The integrated disturbance alerts layer — originally introduced in 2022 and previously called “integrated deforestation alerts” — brings together four independent alert systems, optical and radar-based, to offer the earliest, most confident and most frequent signal of vegetation loss available on the GFW platform. In addition to GLAD-L, GLAD-S2 and RADD alerts, the integrated disturbance alerts layer now includes global vegetation disturbance alerts (DIST-ALERT), which expands the alert coverage to all vegetation both inside and outside of forests globally and detects repeated disturbances. By combining these data sources, users can monitor deforestation and other disturbances more effectively than by relying on any one system alone.
This layer is designed for users who need fast, reliable information for monitoring forests and other ecosystems, responding to illegal activity or prioritizing areas for follow-up.
Which alert systems are included in the integrated disturbance alerts layer?
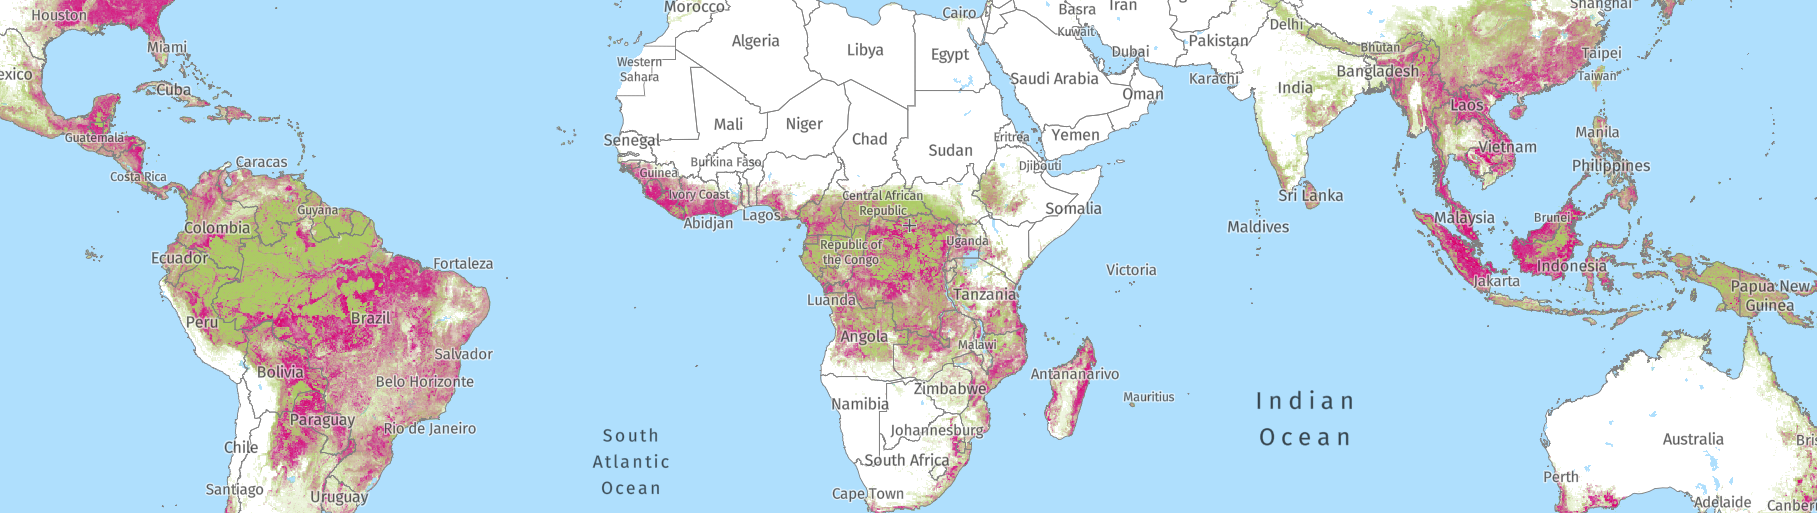
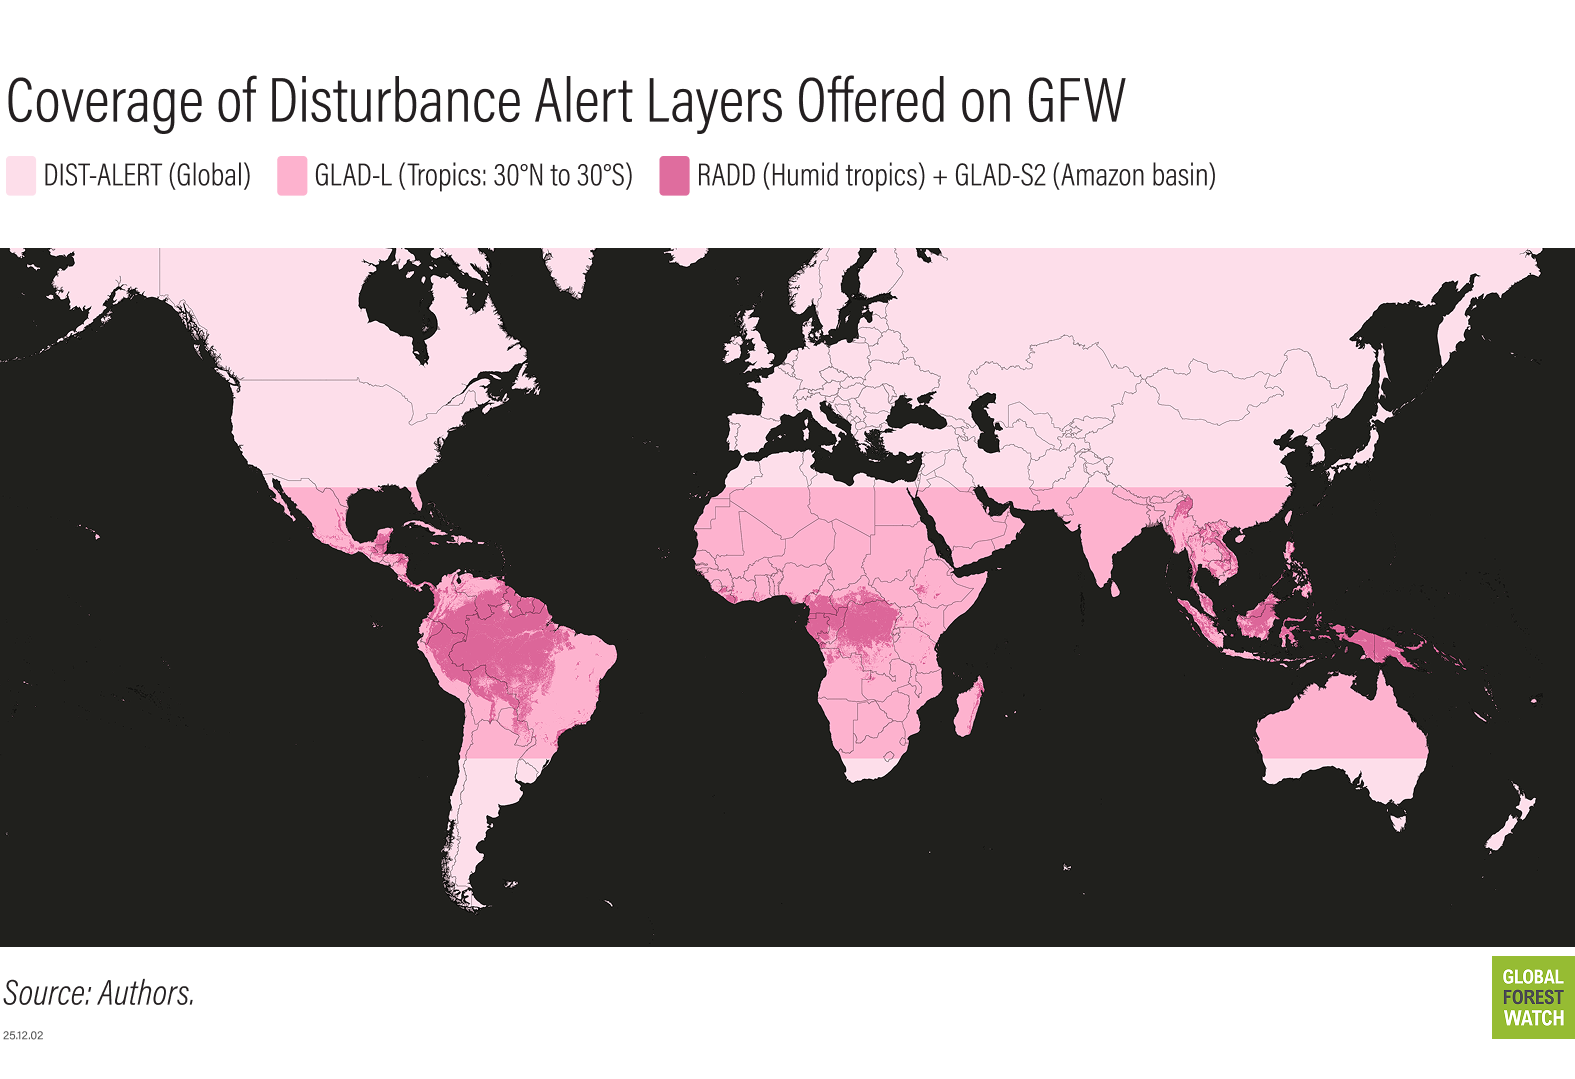
Previously, the integrated alerts layer showed disturbances only within tropical forests. The addition of the 30-meter resolution global vegetation disturbance alerts (DIST-ALERT) system from the University of Maryland (UMD) and NASA expands monitoring beyond forests to all vegetation types — capturing all vegetation disturbances, not only in tree cover — and brings global coverage to the integrated alerts layer for the first time.
With the addition of DIST-ALERT, the integrated alerts layer now includes four alert systems: GLAD-L, GLAD-S2, RADD and DIST-ALERT.
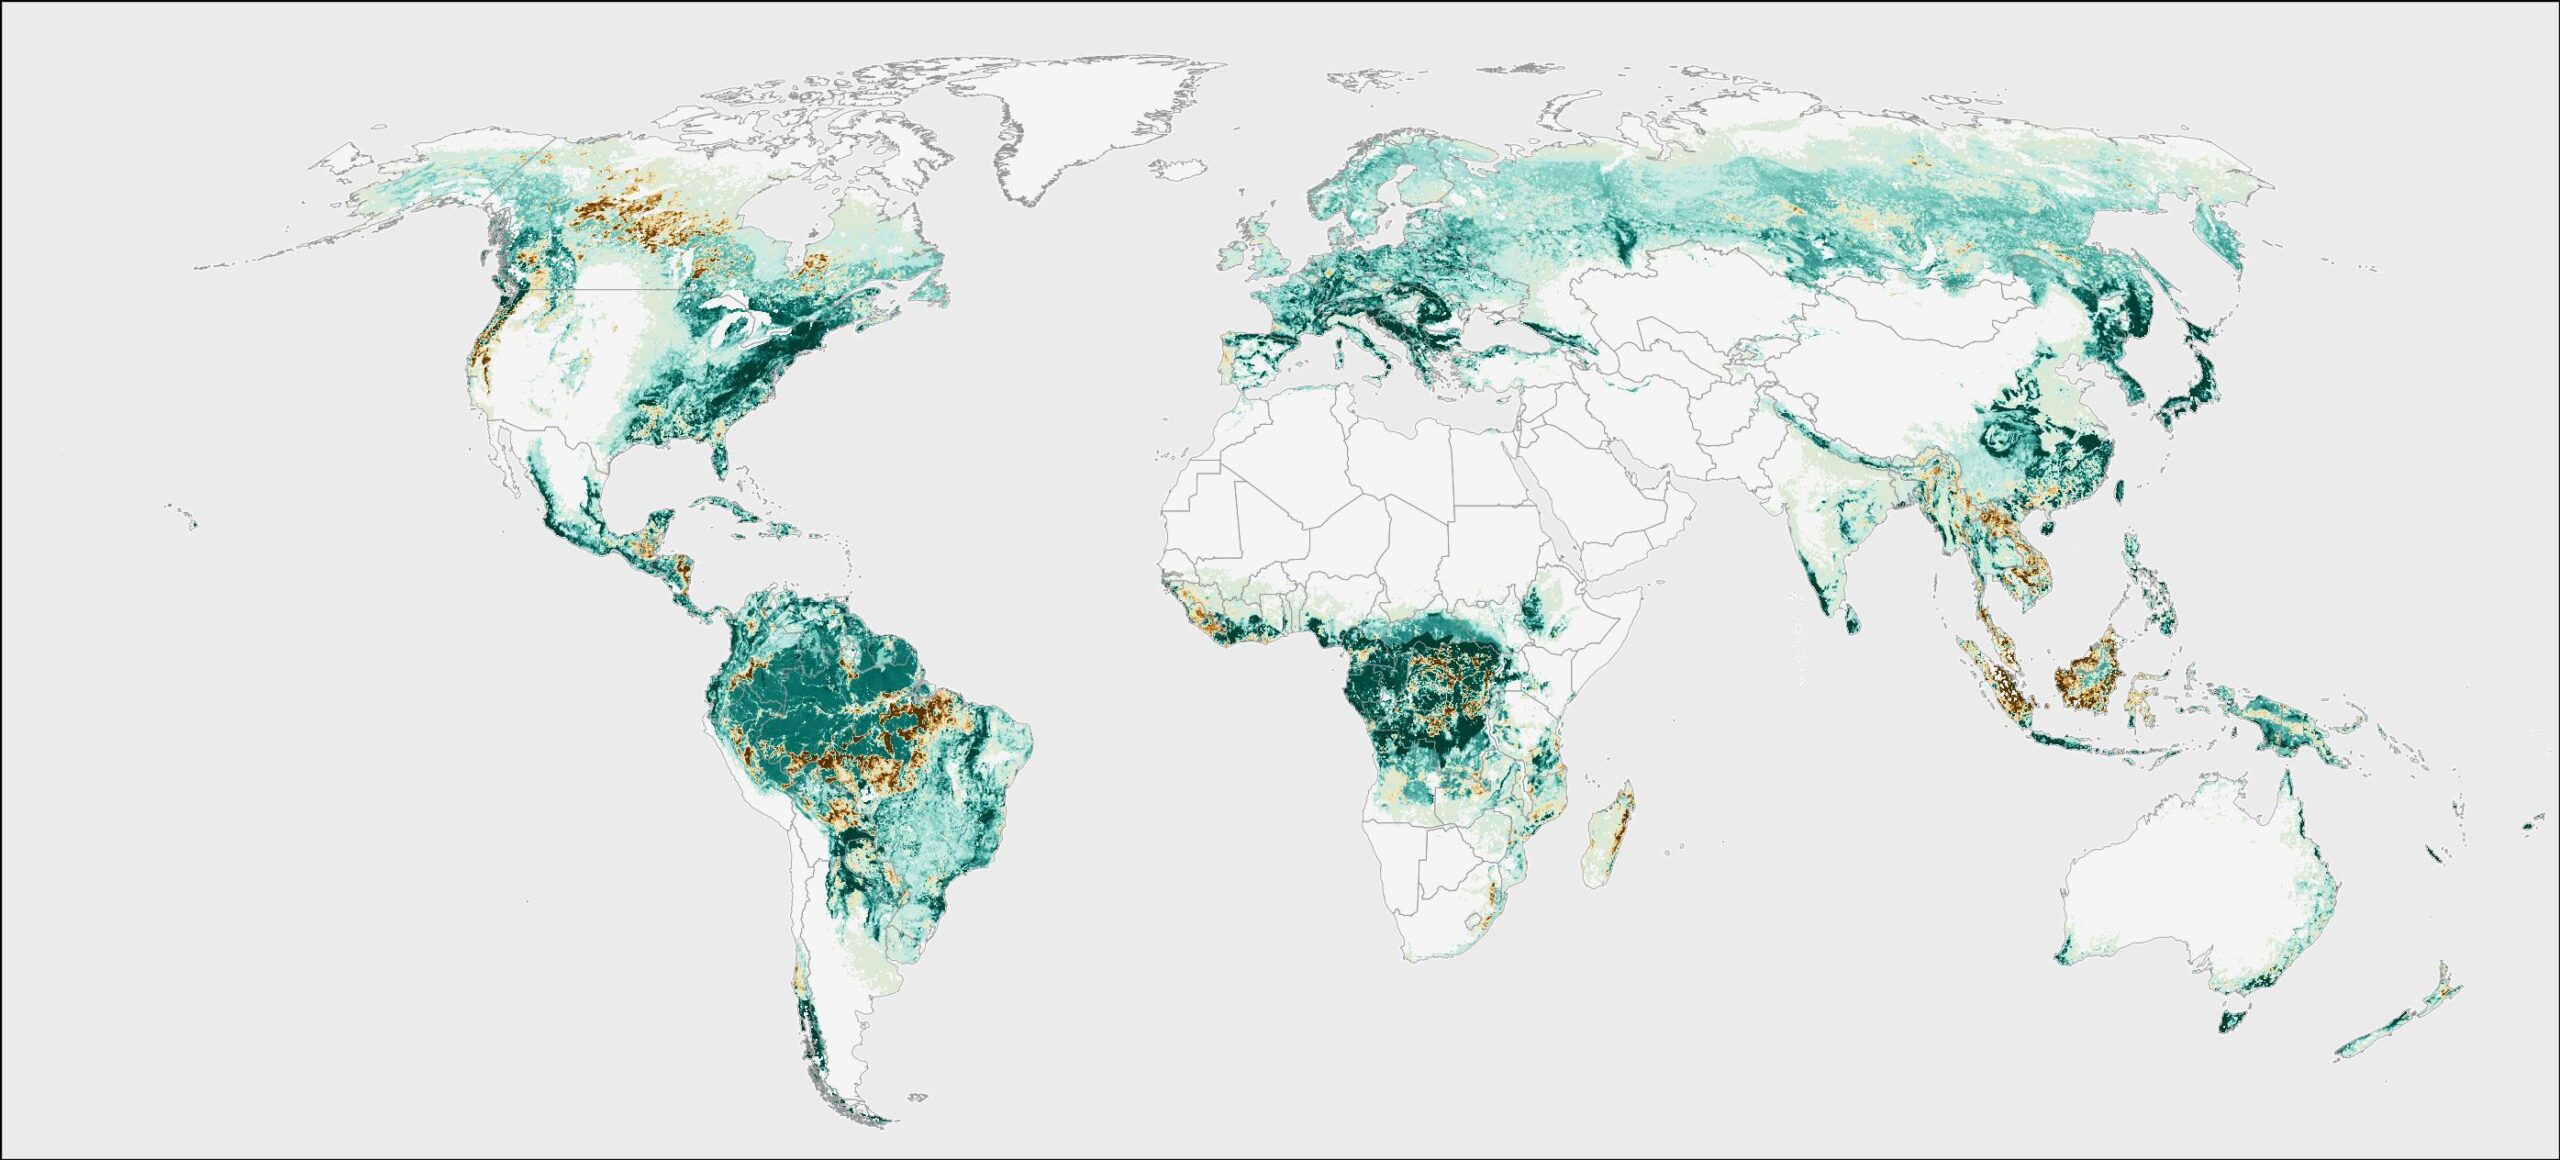
GLAD-L is GFW’s longest-standing alert product from the UMD Global Land Analysis and Discovery (GLAD) lab and uses imagery from NASA’s Landsat satellites to detect tree cover loss at 30-meter resolution.
UMD introduced the higher resolution (10-meter) GLAD-S2 alerts in May 2021, which use a similar methodology to GLAD-L but are sourced from the European Space Agency’s Sentinel-2 satellites. Radar for Detecting Deforestation (RADD) alerts produced by Wageningen University use 10-meter Sentinel-1 radar data. These alerts have the additional capability of detecting forest change through cloud cover that often blocks the view of the other satellites.
One of the greatest strengths of higher resolution (10-meter) RADD and GLAD-S2 alerts is their ability to capture smaller changes in the forest than the 30-meter products. This information has been vital for detecting small canopy gaps from logging activities.
We integrated DIST-ALERT in January 2026, which combines Landsat and Sentinel-2 data to cover disturbances both inside forests as well as in other vegetation. Users who want to focus exclusively on forests can still toggle the option on the map legend to display only alerts within areas of tree cover. This flexibility allows the integrated alerts layer to support both monitoring forests specifically, as well as the broader landscape.
What does the integrated alerts layer offer?
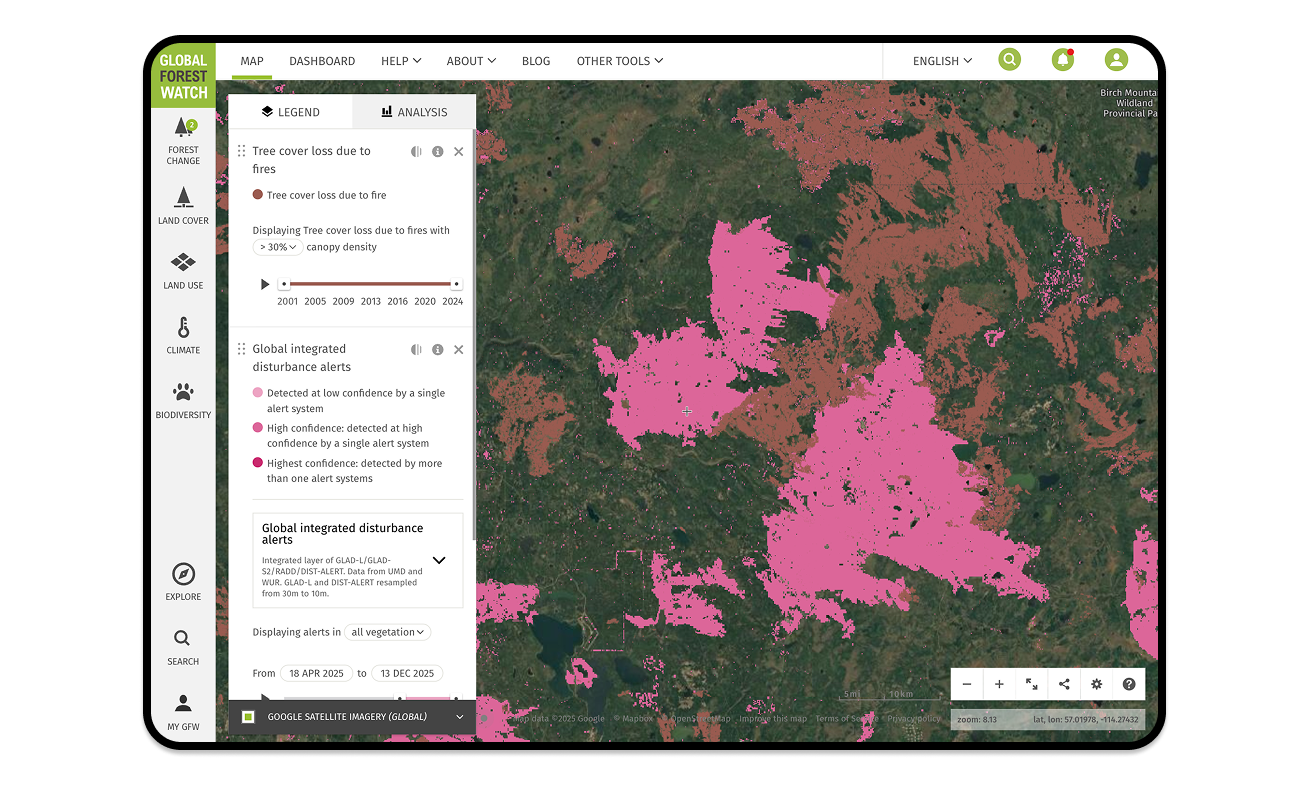
These systems use satellite imagery of different spatial resolution and are updated at varying frequencies. The integrated option (resampled to 10-meter resolution) enables users to derive meaningful summary statistics that incorporate each of the individual systems. To achieve this, the layer indicates where multiple systems have reported an alert in any given location and displays it through confidence levels:
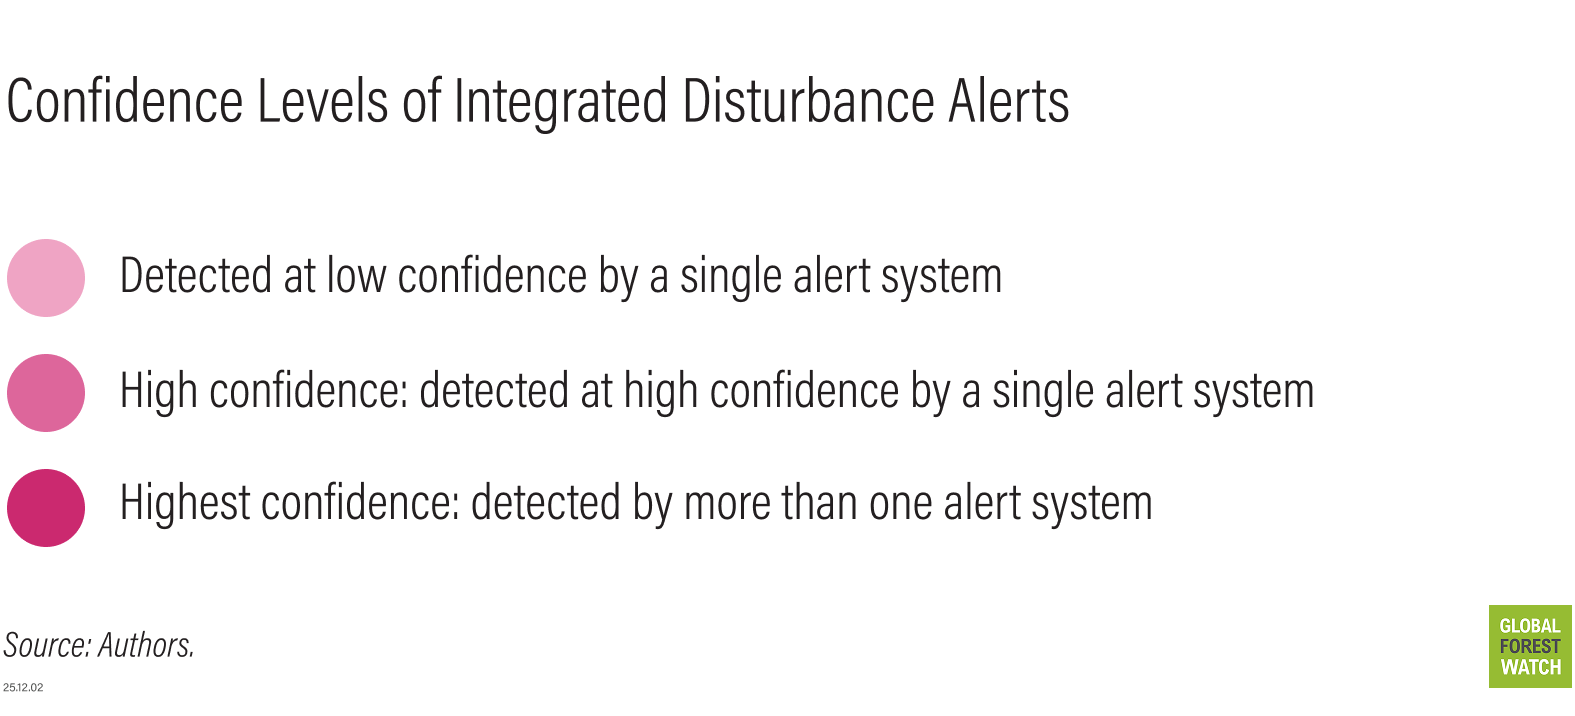
Each individual alert system has its own method of determining confidence based on the number of satellite observations that register a loss of vegetation or tree cover. Across all systems, an alert begins as low confidence when the first signs of potential disturbance appear and is upgraded to high confidence only after additional satellite observations provide further evidence or probability of loss. Highest confidence is only reached when multiple alerts systems detect a disturbance in the same pixel location. To learn more about what the confidence levels mean, click the “Layer info” icon here.
In an important change from the previous versions of the layer, the addition of DIST-ALERT means the integrated alerts layer now detects repeated disturbances. In contrast to many other alert systems available on GFW, DIST-ALERT continues to monitor pixels where it has identified an alert in the past. The DIST-ALERT layer on GFW shows the date of the most recent alert, keeping users informed of the most up-to-date losses of forest and vegetation cover, meaning repeat alerts are captured in the integrated alerts layer for the first time. Alerts from multiple systems that occur within 180 days (six months) of each other are considered a single event and reach highest confidence. In this case, the earliest date within that 180-day window will appear as the alert date in the integrated alerts layer. The date of the alert remains until another new alert outside of the six-month timeframe is registered in the same pixel.
Capturing repeat alerts means that areas where tree cover has regrown (such as areas where restoration has taken place) can be monitored for further disturbances, and areas that increasingly face recurring disturbances like fire can also be tracked.
What are the benefits of combining alerts?
1. Users will always have the earliest information available on new alertsBy combining multiple alert systems into one layer, we are harnessing the different timing of the satellites to increase the chances of getting an unobscured look at tropical forest and therefore detect change faster, as well as inform users of vegetation loss anywhere on the planet. A study on alerts found that integrating alert systems leads to quicker detection of new disturbances, sometimes by days or even months. For example, users looking at integrated alerts from 2021 in the Amazon basin were alerted to forest loss on average nine days earlier than by referring to any one system alone. This improvement in timeliness varies by region and across seasons, as the alert systems complement each other by providing their own strengths. For example, in consistently cloud-covered areas, the radar-based alert system provides an advantage of detecting forest loss through clouds. However, the higher revisit time of the optical alert systems gives a more frequent opportunity to detect disturbances, every one-four days, particularly in areas with a dry season; whereas the radar system may take up to 12 days to detect change. This research was done with just three systems integrated, so we expect even more improved results with a fourth system integrated.
2. The overlap of multiple systems increases confidence to prioritize alerts
Confidence levels help forest monitors prioritize alerts for follow up since satellite-derived data is subject to errors including false alerts. If two or more alert systems detect a change in the same location, we are more confident (“highest confidence”) that these alerts are real vegetation disturbances, rather than errors in the data (known as false positives). For individual systems, there is a delay before a first detection can be verified by additional satellite passes and thus reach “high confidence.” The integrated layer displays where multiple systems overlap, in some cases providing increased confidence faster than waiting for individual systems to reach high confidence through additional satellite images, which can take weeks or months. False positives are effectively eliminated in the highest confidence class as it’s uncommon for two systems to commit the same error since they use different data streams and algorithms.
3. Different loss types are captured across a variety of landscapes
Because of DIST-ALERT, the integrated layer covers not only forests globally but also disturbances in other ecosystems such as grasslands, savannas, shrublands, wetlands and crops. Users who are interested only in forest disturbances can use the tree cover filter to show only alerts within tree cover (defined as all vegetation greater than 5 meters in height (2020) with greater than 30% canopy cover (2010) and where no tree cover loss has been recorded since 2021, and may take the form of natural forests or plantations).
In the tropics, where multiple alert systems are available, the alert systems can be used in concert to identify illegal activities quickly and with increased confidence, a critical tool for both law enforcement and Indigenous Peoples and local communities working to combat deforestation.

Note that the benefits of increased confidence and more rapid detection resulting from multiple monitoring systems are still limited to tropical forests, as areas outside of forests and outside of the tropics are only captured by one system (DIST-ALERT).
What’s next?
Information on drivers of alerts is now available on GFW for the tropics, and is based on the integrated alert layer. This information supports users in prioritizing alerts by distinguishing natural from human-caused disturbances since users may have more interest in investigating human-caused disturbances, such as to assess the legality of forest clearing. In the future, this layer will be updated monthly, based on the last month’s integrated alerts, giving users a quicker picture of the cause of alerts. Stay tuned for future updates to the integrated alert layer and other advancements in the field of forest monitoring.
Get started with integrated alerts
With several alert systems to choose from, we aim to simplify users’ workflows in identifying priority alerts. The integrated layer provides the most information on recent forest disturbances for users who want to be notified of forest loss with the highest confidence and provides up-to-date information on other vegetation losses. Though we see these systems as complimentary to each other, users may still opt to select individual systems for alert notifications and analysis if these suit their needs.
For an in-depth look at how the integrated layer was designed and how to use it, see the Help Center.
Johannes Reiche is an associate professor at Wageningen University and operates the RADD alert system.
This piece was originally published in 2022. It was updated in January 2026 to reflect the latest developments with the integrated alerts.