Artificial Intelligence Helps Distinguish the Forest From the Trees: Part 1

DCIM100MEDIADJI_0310.JPG
Since 2015, World Resources Institute (WRI) and Orbital Insight have worked together with a grant from the Generation Foundation to find new applications of computer vision and deep learning that will support Global Forest Watch in better monitoring the world’s forests.
This blog is Part I of a series that explores our latest project working to identify where oil palm is being planted and grown across large areas of the tropics. In this post, we break down the real-world implications of mapping agricultural plantations. See Part II for a dive into the technological foundation of our planted forest classifier.
Ever wonder how Facebook can recognize your face in an image? Or how Google automatically categorizes your pictures based on their content? This approach, known as deep learning, deploys artificial neural networks which can learn to recognize patterns in data without hard-coded rules. These networks can quickly recognize which features, such as color or shape, to look for in an image and understand how those features constitute a person or object.
Aside from helping organize your vacation photos, deep learning has also been used to support efforts like disease diagnosis, language translation and self-driving car navigation. Now, Global Forest Watch (GFW) and Orbital Insight are using this approach to help tackle commodity-driven deforestation. Combining expertise in forest monitoring with experience in high resolution satellite data analysis, our teams are working to map palm oil plantations in Malaysia, Indonesia, Cambodia and Colombia, with plans to do the same for Papua New Guinea, Peru, Liberia, Guatemala and Honduras soon.
Why map agricultural plantations?
Around the world, carbon rich and biodiverse forests are being cleared at an alarming rate to make way for agriculture and the production of other commodities. Deforestation related to commodities accounts for over a quarter of the world’s tree cover loss, mostly centered in the tropics. Industrial scale plantations for global commodities like palm oil have been particularly problematic, resulting in large-scale deforestation across Southeast Asia. The good news is that over the last several years we’ve seen unprecedented ambition to tackle this problem. Currently more than 400 companies, including oil palm producers, within the Consumer Goods Forum have pledged to achieve zero net deforestation in their agricultural supply chains by 2020. As a result, over 97 percent of globally traded oil palm is under a “zero deforestation” commitment.
Unfortunately, these commitments are only half the battle. Despite the presence of palm oil in common household items like shampoo and peanut butter, determining if a product contributed to deforestation isn’t easy. For commodity buyers, traders and suppliers to uphold their zero deforestation commitments, they must be able to identify where they are sourcing from and determine whether those areas were deforested to serve production.
Deep learning as a solution
Using traditional methods that rely on the characteristics of individual pixels, it can be difficult to differentiate palm plantations from other forms of tree cover like natural forests. Now, with deep learning, we have developed the first prototype method for automatically detecting palm plantations using satellite imagery.
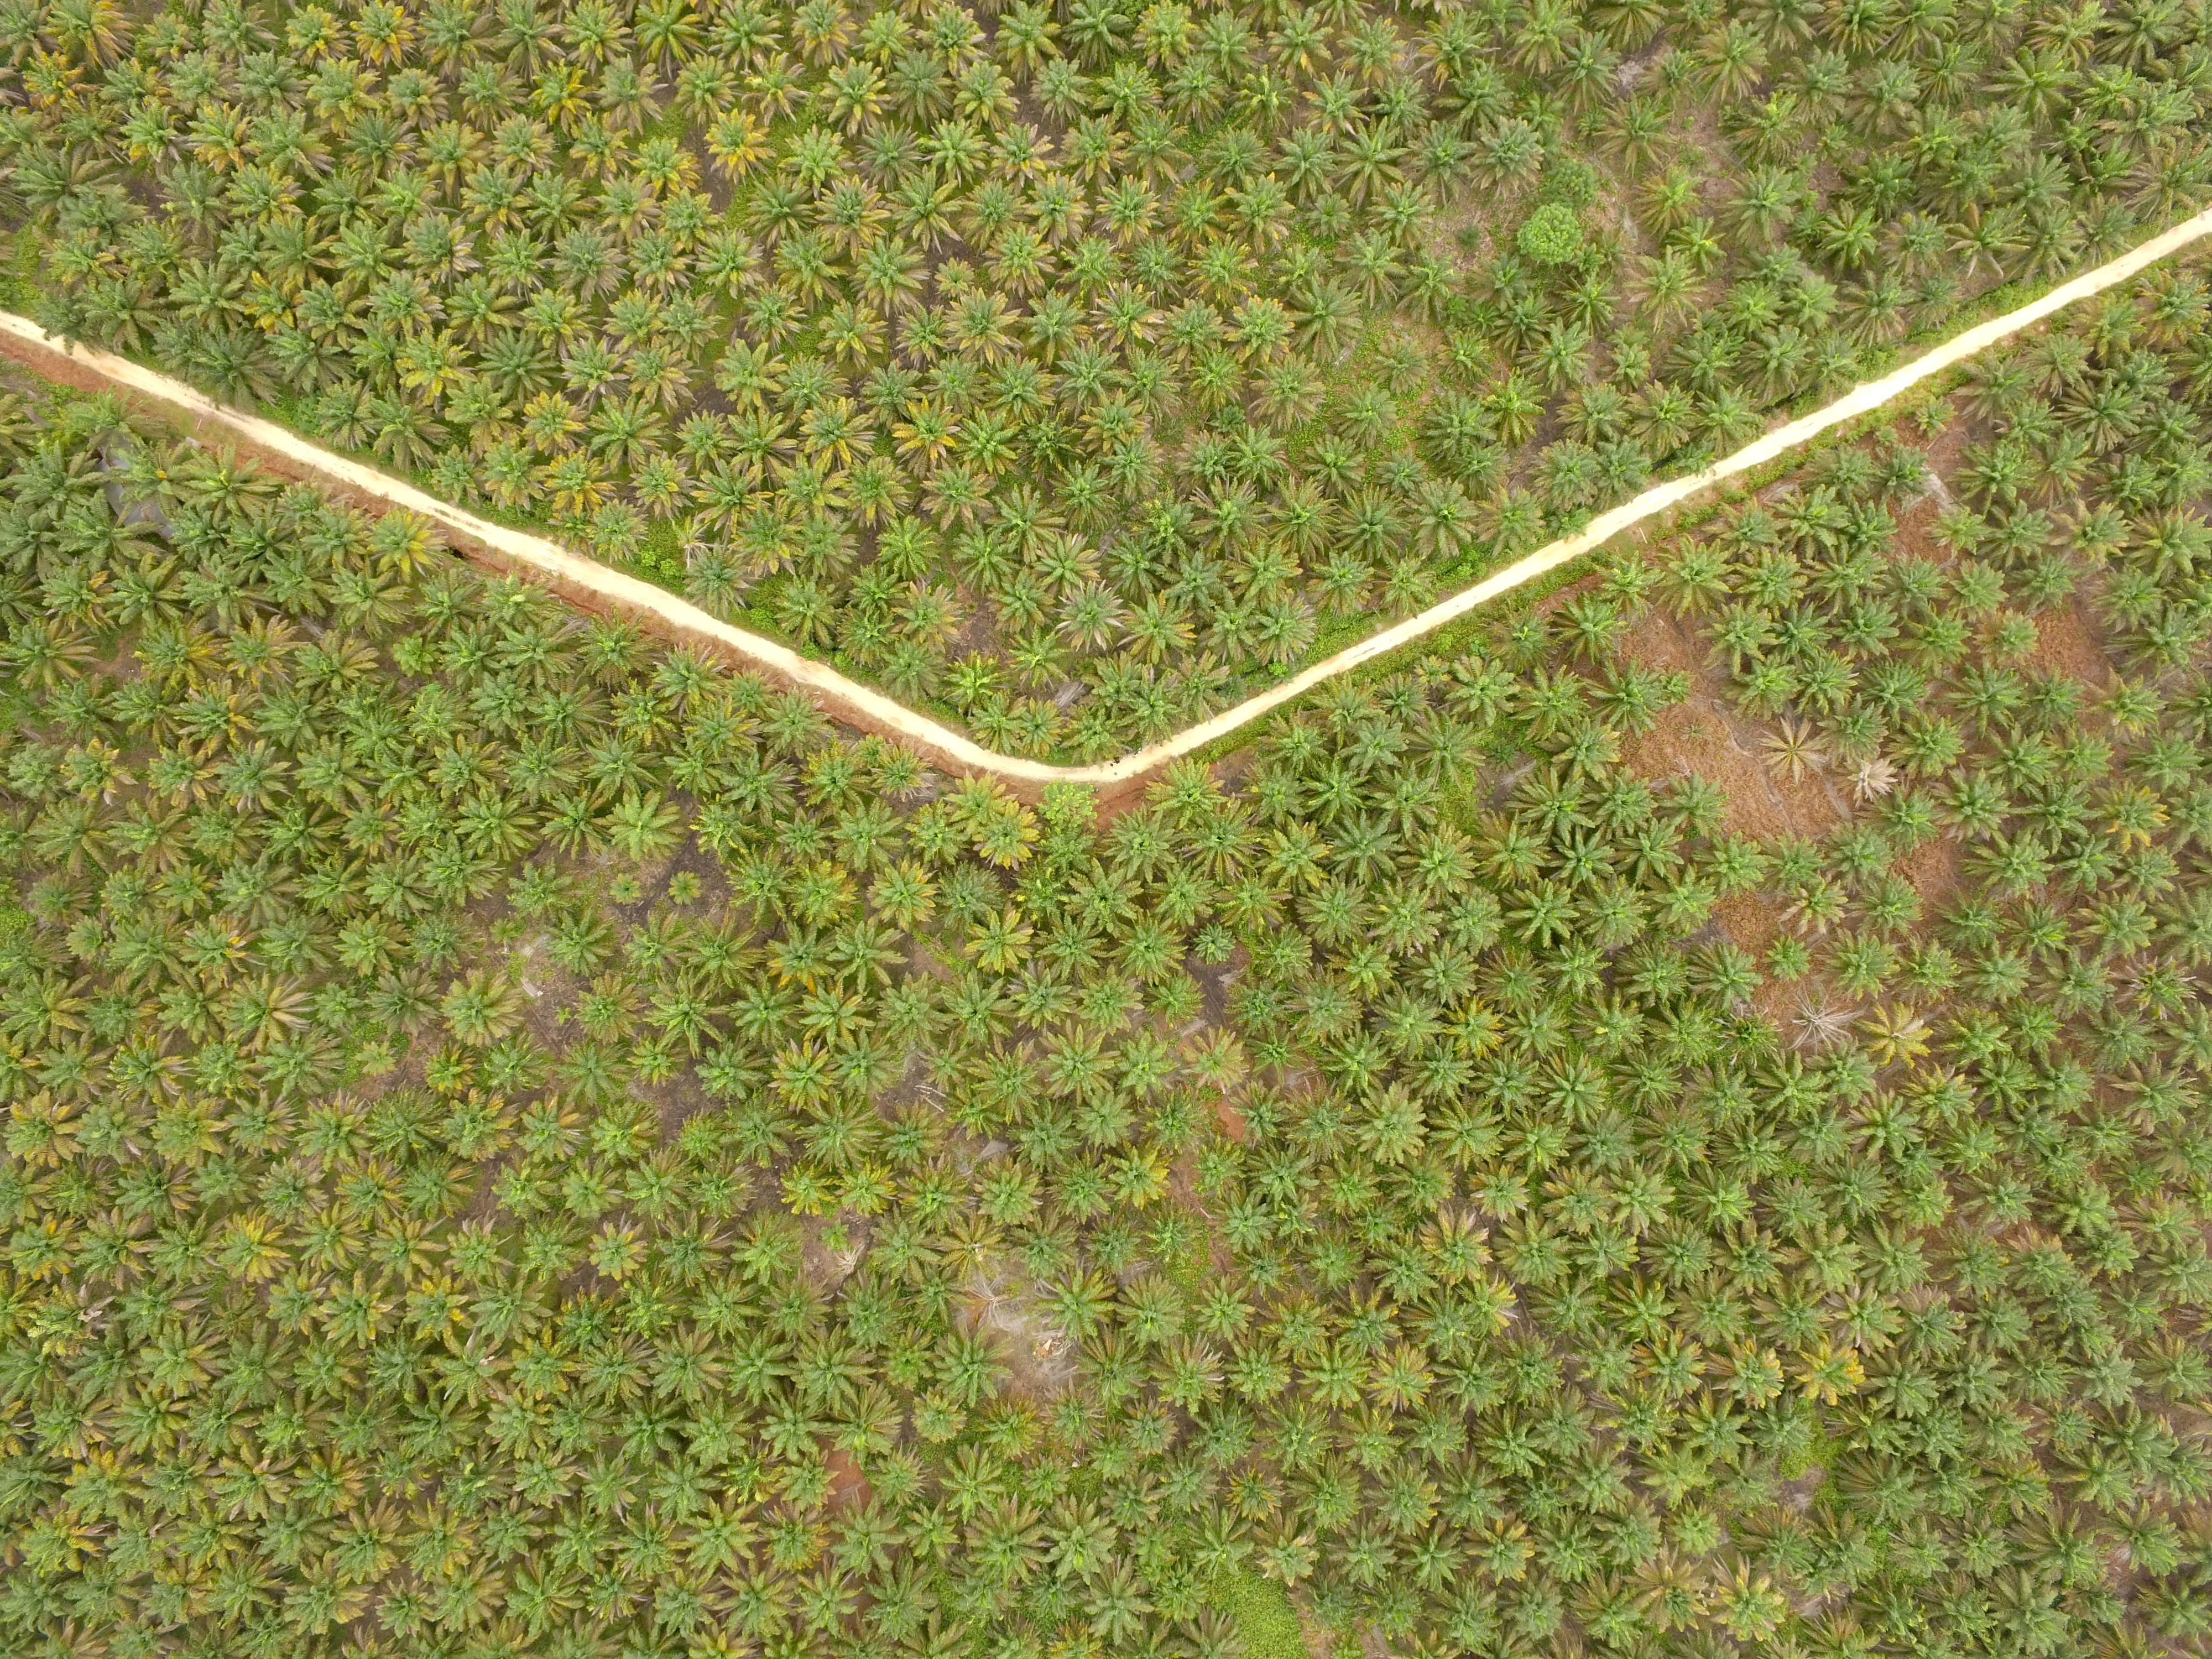
![[OPTIONAL DESCRIPTION]](https://content.globalforestwatch.org/wp-content/uploads/2018/12/DJI_0324.jpg) Palm oil production from above. Ridhwan Siregar/WRI Indonesia
Palm oil production from above. Ridhwan Siregar/WRI IndonesiaUnlike traditional methods for mapping forest cover that rely on how “green” certain pixels are in a satellite image, deep learning looks at the broader context of an image and can differentiate plantations based on their color, size, shape and pattern. Orbital Insight’s ability to process large data volumes allowed us to also use high resolution images from the satellite imagery company, Planet. These high resolution images enabled the system to more easily identify the patterns of trees and roads more indicative of plantations.
To our knowledge, this is the first prototype of its kind to map oil palm trees across four continents using deep learning. While the application of deep learning and cloud computing offers an automated approach to mapping plantations, the system does have some tradeoffs. At times, the deep learning model misclassifies other types of industrial plantations, like banana, as oil palm. Further, the high cost of commercial imagery may pose challenges for expanding and continuously updating these maps in the future.
Though the data isn’t perfect, this new method brings us closer to understanding where forests are being replaced by industrial oil palm. Experience has taught us that the presentation and delivery of data is crucial to creating information that is actionable – so once the data is finalized, it will be integrated into GFW Pro, where companies can assess deforestation risk in their supply chains.
As we detail in Part II, working with such cutting-edge technology has made research and development both time consuming and costly, but we are confident that this effort is an important first step to better monitoring plantations.
BANNER PHOTO: Palm oil plantation. Ridhwan Siregar/ WRI


