New Data on GFW Provides the Most Detailed Look Yet of What’s Driving Forest Loss Globally
Over the past several decades, forest loss has been a stubbornly persistent problem that can disrupt ecosystems, biodiversity and climate stability, as well as negatively impact forest-dependent people around the world.
However, not all forest loss is created equal. Deforestation, which typically refers to the permanent conversion of forests to other land uses, often has more severe carbon and ecological impacts compared to temporary forest disturbances such as from logging and other natural and anthropogenic causes.
To better track and differentiate these changes, Global Forest Watch (GFW), Land & Carbon Lab and Google DeepMind have developed a new global data set — available on GFW — on the drivers of tree cover loss at 1-kilometer (km) resolution from 2001 to 2024. Previously, data on drivers was available at 10-km resolution. The development of this data was led by The Sustainability Consortium and provided the foundation for the new 1-km data set. The higher resolution of the new data makes it possible to assess drivers in local or regional applications for the first time. The new data also has more driver classes, providing the most detailed view of drivers yet.
Thanks to this increased granularity, the new data can be used to support the development of forest conservation and management policies, inform supply chain actors and governments bodies about the causes of deforestation, carbon emissions and biodiversity loss within their supply chains and jurisdictions, and track progress towards global goals to end deforestation.
How was the new drivers of tree cover loss data developed?
The new drivers of tree cover loss data, part of a World Resources Institute (WRI) and Google DeepMind collaboration, was developed using deep learning, which is a type of advanced AI model. We developed a customized Residual Network (or ResNet, a convolutional neural network model) that uses publicly available satellite observations from Landsat 7 & 8 and Sentinel 2 along with additional satellite-derived biophysical and population data relevant to the driver classes (see Table 2) to predict the dominant driver of tree cover loss from 2001 to 2024 at 1-km resolution.
To train the model to make accurate predictions, we visually interpreted nearly 7,000 training samples using very-high resolution imagery. The model uses these labeled samples to learn how to associate the patterns from the input satellite imagery and other supporting data with a driver class. ResNet is a powerful AI algorithm because it uses many data transformations (or “layers”) to extract important features or patterns from an image. It can handle intricate tasks like recognizing objects in images more accurately and efficiently than traditional machine learning approaches.
We also collected an independent stratified random sample of 3,574 1-km plots to estimate the accuracy of the final drivers of tree cover loss map. Both the training and validation data sets are available on Zenodo and WRI’s Data Explorer. You can learn more here about the methodology behind the new data.
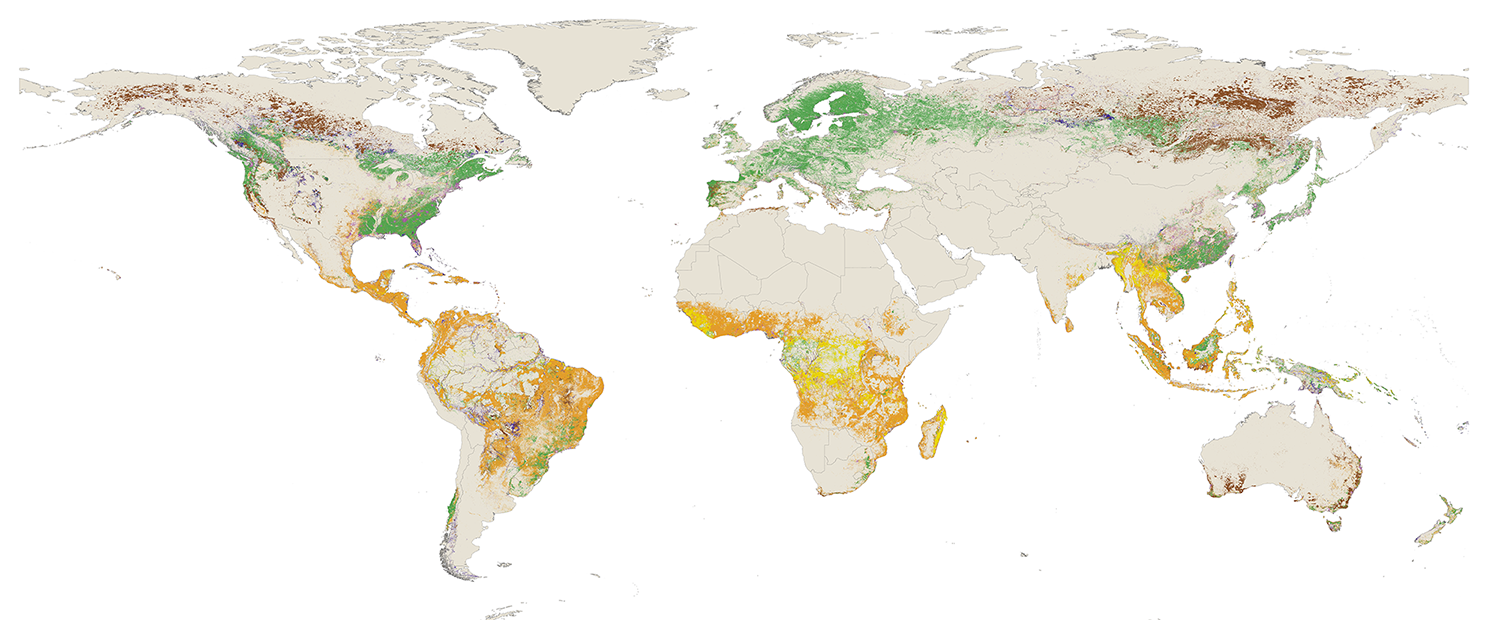
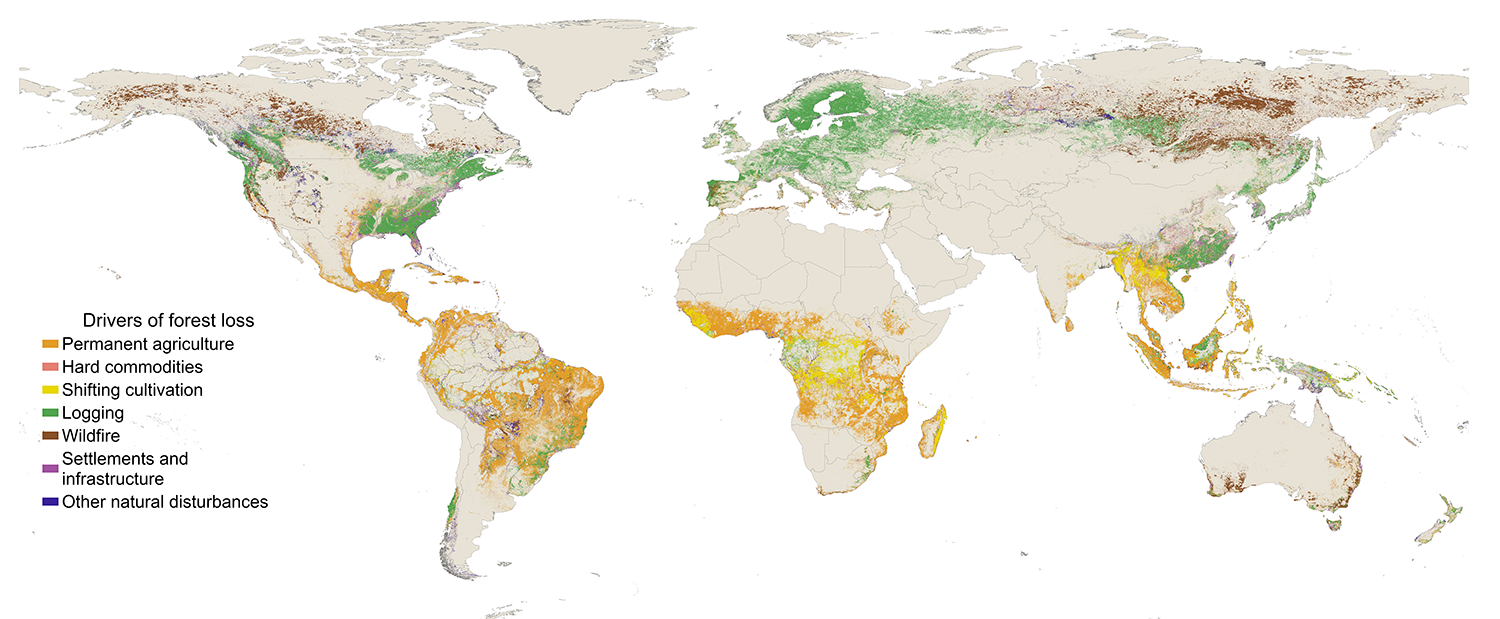
The data distinguishes between seven classes of drivers: permanent agriculture, hard commodities, shifting cultivation, logging, settlements and infrastructure, wildfire, and other natural disturbances. The dominant driver is defined as the direct driver that caused the majority of tree cover loss area within each 1-km grid cell from 2001 to 2024.
In addition to the drivers of tree cover loss classification, we also created seven probability layers, one for each of the seven driver classes. With these layers, users can implement different probability thresholds to customize the driver classification based on their knowledge of a region of interest. For example, a stakeholder in Southeast Asia interested in understanding tree cover loss due to palm oil expansion can select a custom threshold for the permanent agriculture class (e.g., greater than 0.7), and can exclude areas where probabilities of multiple drivers are high (e.g., no single class has a probability higher than 0.6) as those are more uncertain. The probabilities are available on WRI’s Data Explorer and Google Earth Engine.
Despite the improvements the new data provides, there are some limitations:
- The map does not distinguish between the loss of natural forest and planted trees. For example, logging can occur in both natural forests and plantations. Similarly, permanent agriculture, hard commodities, and settlements and infrastructure classes represent a close approximation of deforestation but do not always represent the conversion of natural forests to other land uses.
- We do not disentangle different drivers that are co-located at scales smaller than 1- km or that occur in quick succession in time.
Read more details here about the limitations of the data.
Where can I find the new drivers of tree cover loss data on GFW?
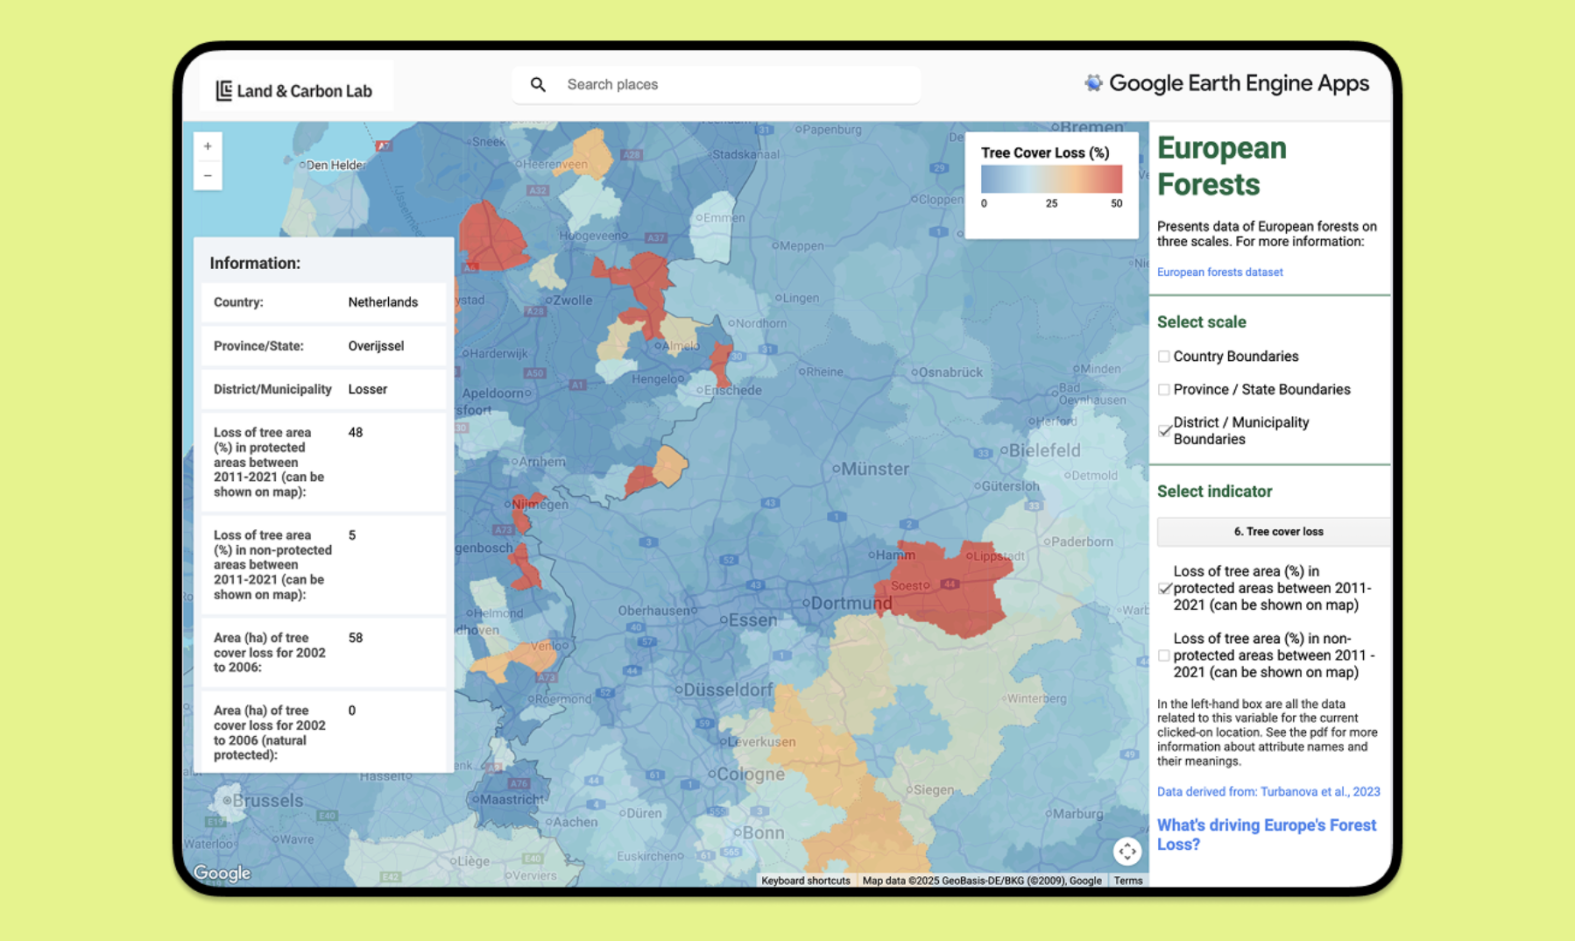
Users can access the data on the GFW map. Users can also analyze the area and proportion of loss attributable to each driver from 2001 to 2024 within their area of interest.
Note that results from the previous drivers of tree cover loss data were displayed on the GFW dashboard as a bar chart time series, while results from the new data are displayed as a donut chart. We have changed the visualization to better reflect the characteristics of the underlying data set — the dominant driver of tree cover loss for the full time period between 2001 and 2024.
How does the new drivers of tree cover loss data compare with the previous data?
Compared to the previous drivers of tree cover loss data set, the new data has the following improvements:
- Higher spatial resolution
- Improves differentiation between small-scale commodity crop production and shifting cultivation
- Improves detection of small-scale drivers, such as small wildfires, settlements and infrastructure, and selective logging
- More driver classes
- Separates commodity-driven deforestation into two separate classes: permanent agriculture and hard commodities (i.e., mining and energy infrastructure)
- Adds a new class: other natural disturbances (e.g., storms, flooding, landslides, etc.)
- Higher accuracy and added probability layers
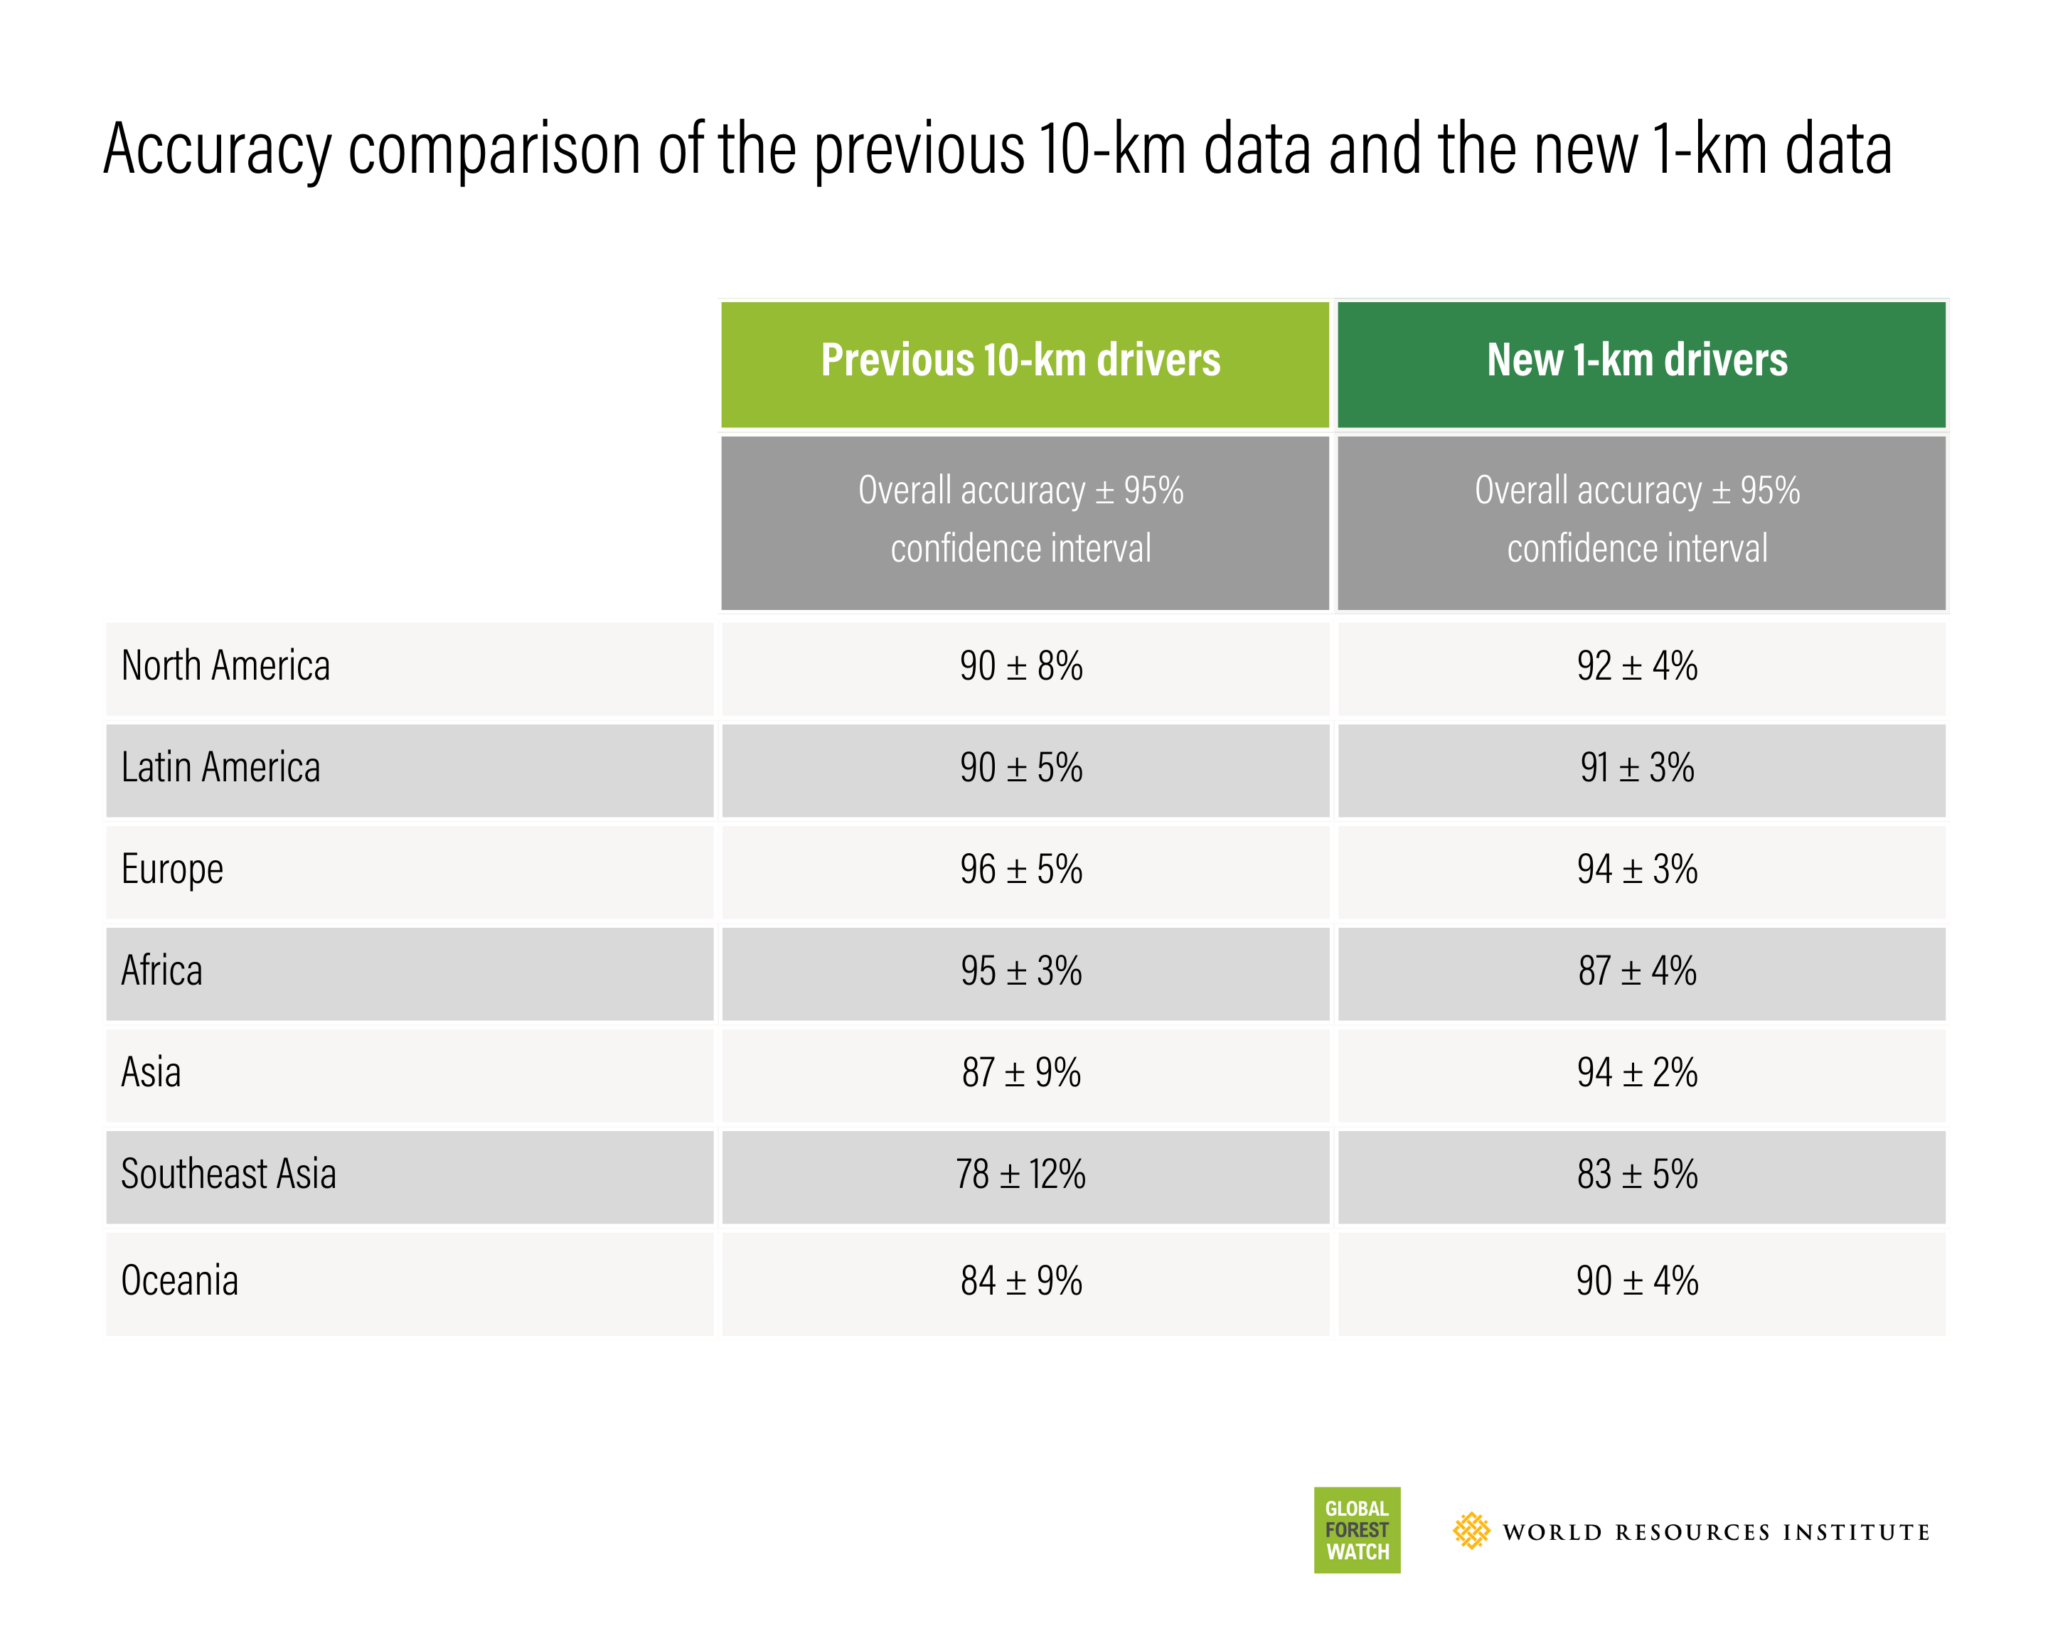
- Has higher accuracy for most regions (except Europe and Africa) and smaller confidence intervals across all regions
- Provides probability layers, one for each of the seven driver classes
Specifications of the previous 10-km data and the new 1-km data
| Data set | Geographic coverage | Years of coverage | Spatial resolution | Number of driver classes | Number of layers | Global overall accuracy |
| Previous 10-km drivers data (Curtis et al., 2018) | Global | 2001-2023 | 10-km | 5 | 1 | 89 ± 3% |
| New 1-km drivers data (Sims et al. 2025) | Global | 2001-2024, to be updated annually with new tree cover loss data | 1-km | 7 | 8, 1 for driver classes and 7 layers of probabilities | 91 ± 1% |
These improvements can be seen when comparing the two data sets in various places.
The new data differentiates small scale fires from logging in Oregon, USA. The previous data in the same location classifies all loss as forestry.
The new data detects mining, smallholder cocoa production, and urban expansion outside Kumasi, Ghana. The previous data in the same location classifies shifting agriculture and urban expansion.
The new data detects selective logging, fires and flooding for hydropower in the Ouésso District of the Republic of Congo. The previous data in the same location classifies all loss as shifting agriculture.
Due to the substantial improvements the new data offers, we recommend using the 1-km drivers data set for analysis of tree cover loss drivers going forward. However, the previous 10-km data can still be accessed via the GFW open data portal.
How can the new data be used and what does it tell us about drivers of tree cover loss?
On a global scale, our analysis of the new data reveals that most tree cover loss can be attributed to three main drivers: permanent agriculture, wildfire and logging. But while drivers like other natural disturbances, hard commodities and settlements and infrastructure represent a relatively small proportion of loss globally, they can play an important role regionally. Read more here about findings from the data on what’s driving tree cover loss.
This analysis demonstrates how the higher level of spatial detail in the new map provides useful contextual information for users to understand the nature of tree cover loss in their local area of interest. For example, using the map, GFW users can now separate tree cover loss due to expansion of “soft” agricultural commodities from “hard” commodities such as minerals, better characterize selective logging in the tropics and better differentiate permanent agriculture from shifting cultivation. Moreover, this map represents a major advancement in differentiating between natural and anthropogenic losses by detecting events such as bark beetle outbreaks, hurricane damage, meandering rivers and other natural disturbance events.
Because these improvements allow us to disentangle deforestation from temporary disturbances in greater detail, the new data improves our ability to track progress towards reducing deforestation such as in the Forest Declaration Assessment, the Global Forest Review Targets Tracker and the State of Climate Action report.
The new data can be used to support the development of forest conservation and management policies by making it possible to pinpoint the causes of deforestation hotspots at finer scales than ever before possible. Detailed insights allow policymakers and conservationists to design tailored interventions to address specific drivers such as logging, for example, and to hold accountable governments and organizations based on their conservation commitments.
Additionally, using this new data, we can refine maps of greenhouse gas emissions due to tree cover loss by assigning different amounts of emissions to each driver of loss. It also improves our understanding of the causes of emissions from tree cover loss.
What’s next for 1-km global drivers of tree cover loss data?
This new data replaces the previous 10-km data across the whole GFW platform and in all analyses, such as GFW’s carbon flux model. The new data is used in the 2024 analysis of tree cover loss and in the updated Global Forest Review. We will update the new 1-km drivers of tree cover loss data annually.
In the future, we plan to develop an AI model to map drivers of tree cover loss at even higher temporal and spatial resolution to understand how different drivers play out over time. Annual data on the drivers of tree cover loss is critical for assessing deforestation after specific cutoff dates relevant for policy commitments such as European Union Deforestation Regulation (EUDR) and for quantifying trends in drivers such as expansion of commodity agriculture.