Turning Over a New Leaf: GFW’s New Map Makes It Easier to Explore, Analyze and Customize Forest Data
Visitors to the Global Forest Watch map this week may have noticed some changes in the design. These changes go beyond what you see on the surface. The new map is faster, facilitates customization and makes exploring and analyzing forest data even easier.
Not sure where to start? Use the new search and explore features
While our diverse collection of data sets still remains, we’ve reorganized the data layers into categories grouped by purpose and scope. If you’re looking for a particular type of data, or data that pertains to a specific country, check out the improved search tool to quickly find what you’re looking for. If you’re not looking for any specific dataset, our new explore tab is designed for the curious user. With curated combinations of layers, you can investigate the map based on a variety of forest topics.
Analyze forest change for new areas with one click
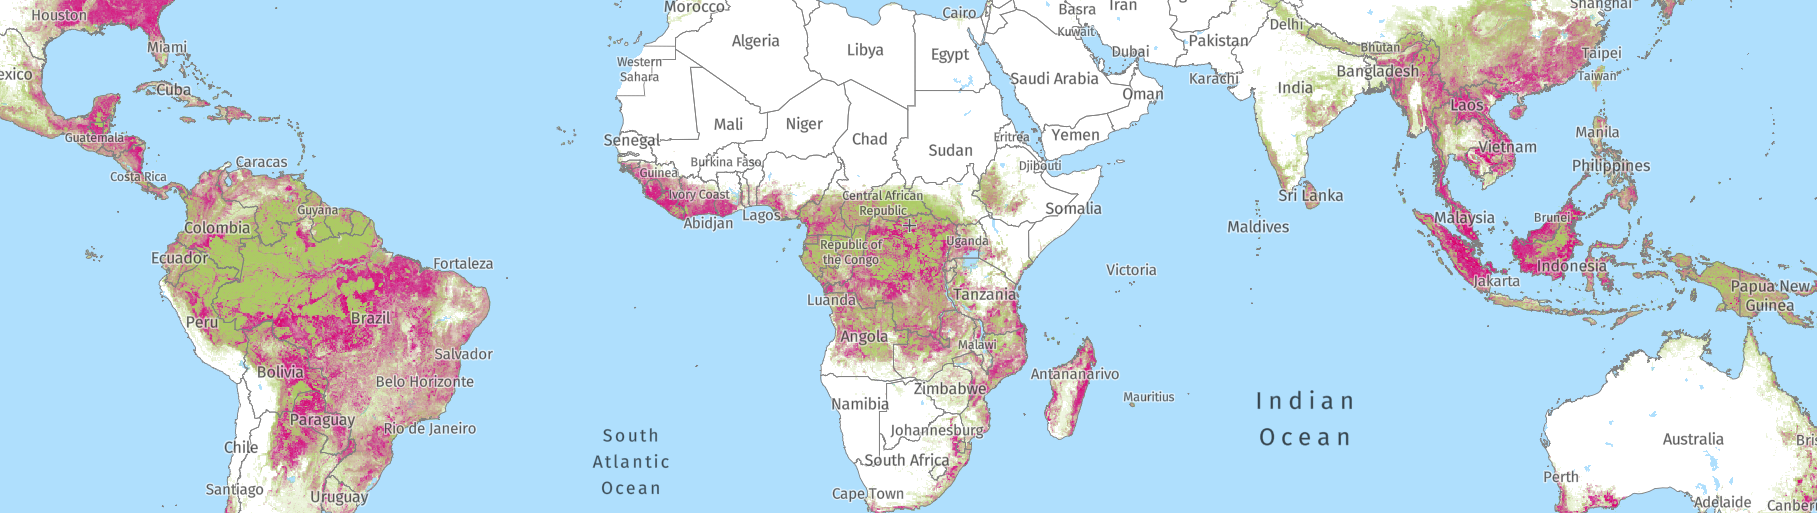
The addition of new boundaries for analysis offers new possibilities for the kinds of questions users can ask of our data. Take, for example, the Congo rainforest in central Africa. This rainforest encompasses about 1.8 million square kilometers — nearly 90 percent of all African rainforest. Though much of this forest falls within the borders of the Democratic Republic of Congo, neither the Congo River that supports the forest ecosystem nor the trees growing along its banks pay heed to political boundaries, which makes getting a precise analysis a tricky task.
With this map update, we’ve added two new ways to analyze areas on the map. The first enables analyses based on river basins. This allows us to separate forests based on their natural geography. When we look at tree cover loss in the Congo River Basin, we see a different story than we would using political boundaries.
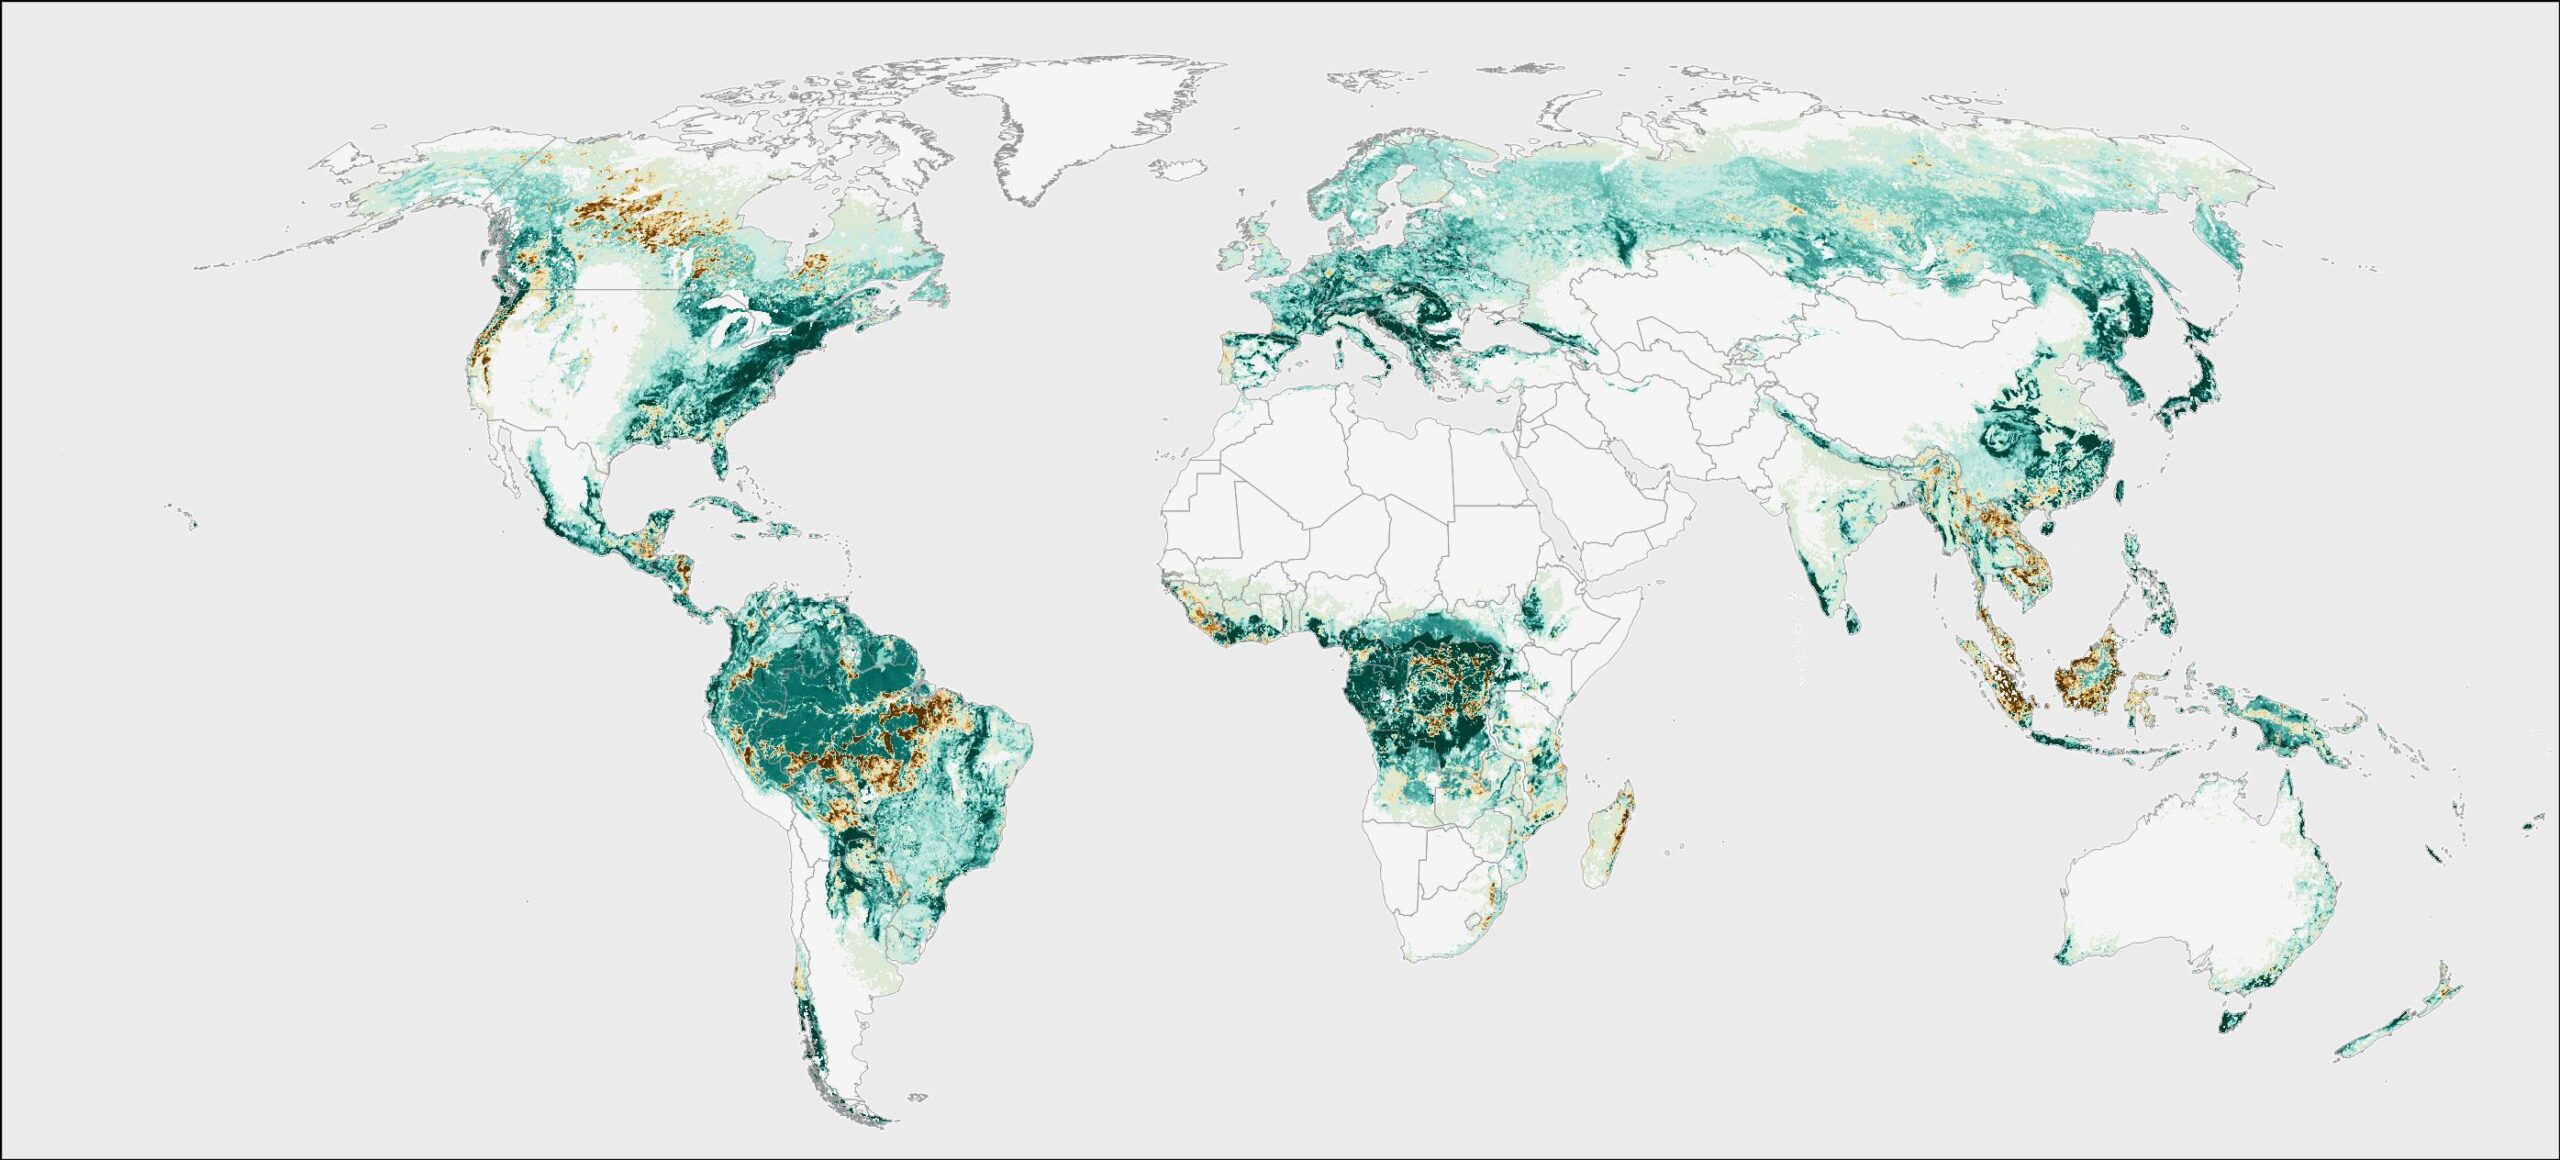
Despite its unified appearance however, the Congo rainforest is actually comprised of smaller forest ecosystems called “ecoregions.” The new map also enables users to conduct analyses based on these ecoregions. When you divide the Congo Basin this way, one giant band of forest becomes six — each of which can be analyzed in one click and easily compared.
 The six ecoregions of the Congo rainforest.
Customize the GFW map experience
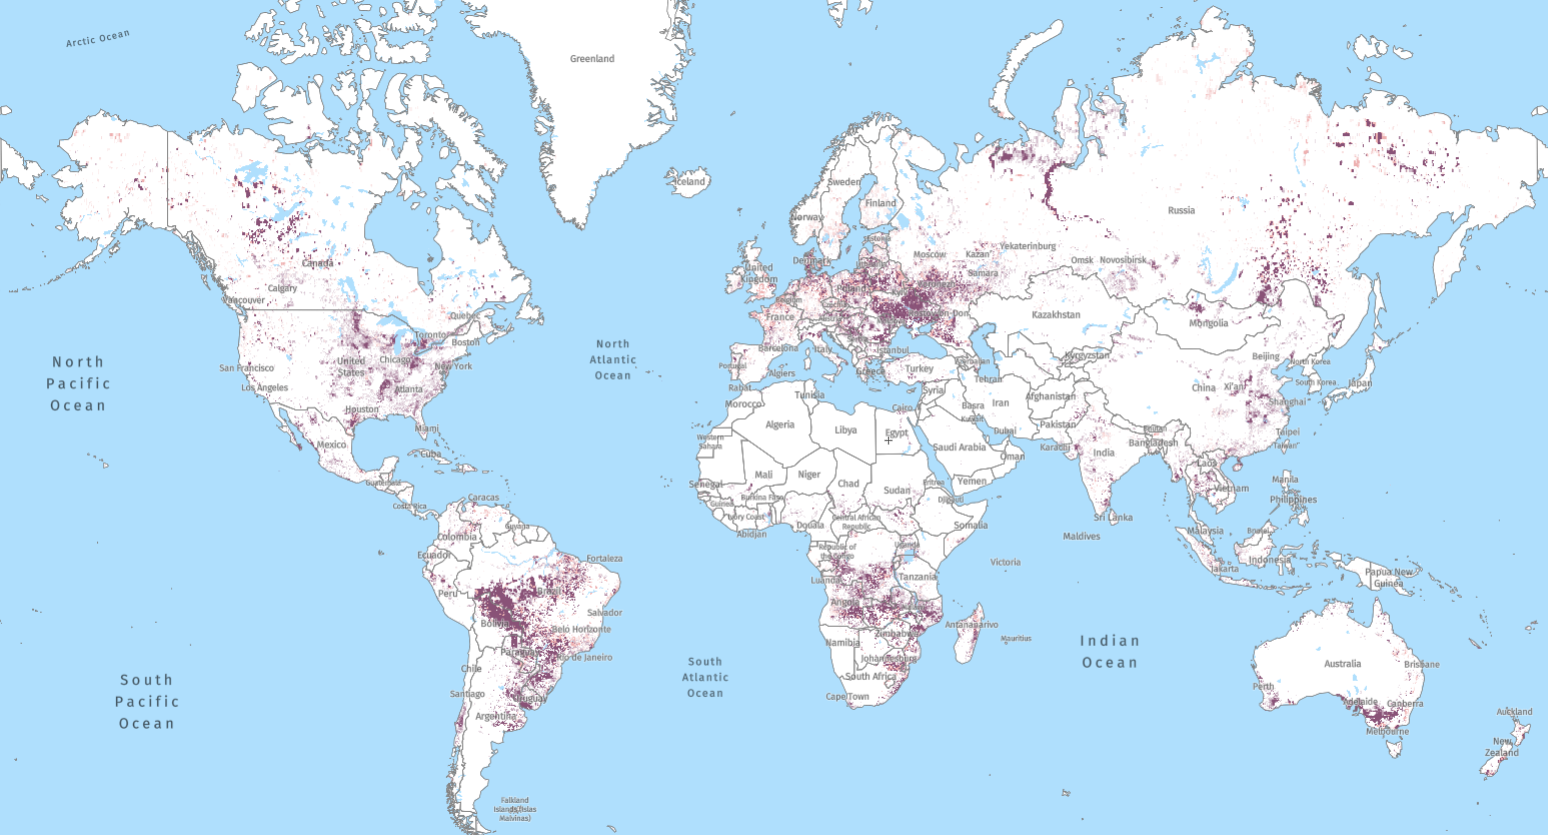
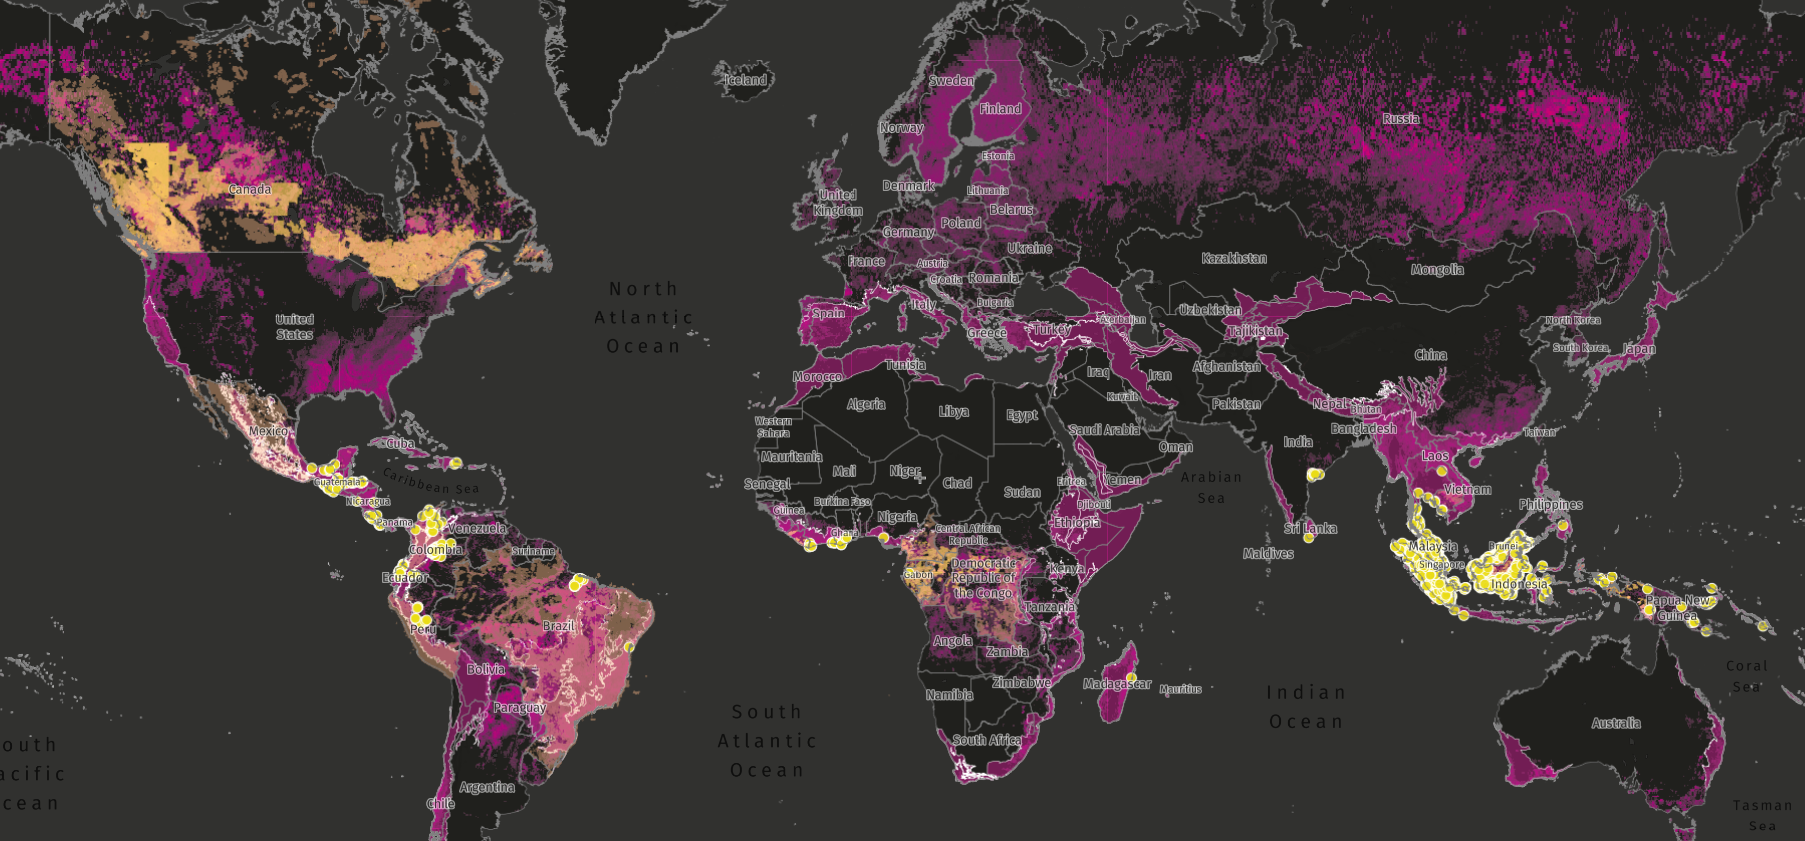
The new map also boasts improved customization. Active layers, for example, can be rearranged to send larger shapes, like tree cover, to the back, and bring more detailed data, like GLAD alerts, to the front. Opacity of various layers can now be adjusted, allowing users to clearly view more data at a time on the map.
 With the customization updates to the GFW map, users can adjust the transparency of data layers.
Basemaps can be customized too. Users can alter labels and boundaries separately to create a basemap that meets their mapping needs.
As GFW grows and changes we welcome your feedback on how to improve the platform. Explore the updated map and let us know your thoughts through this survey, or in the comments below.