- Data & Tools
Where are Species Most at Risk? New GFW Biodiversity Maps Help Prioritize Areas for Conservation
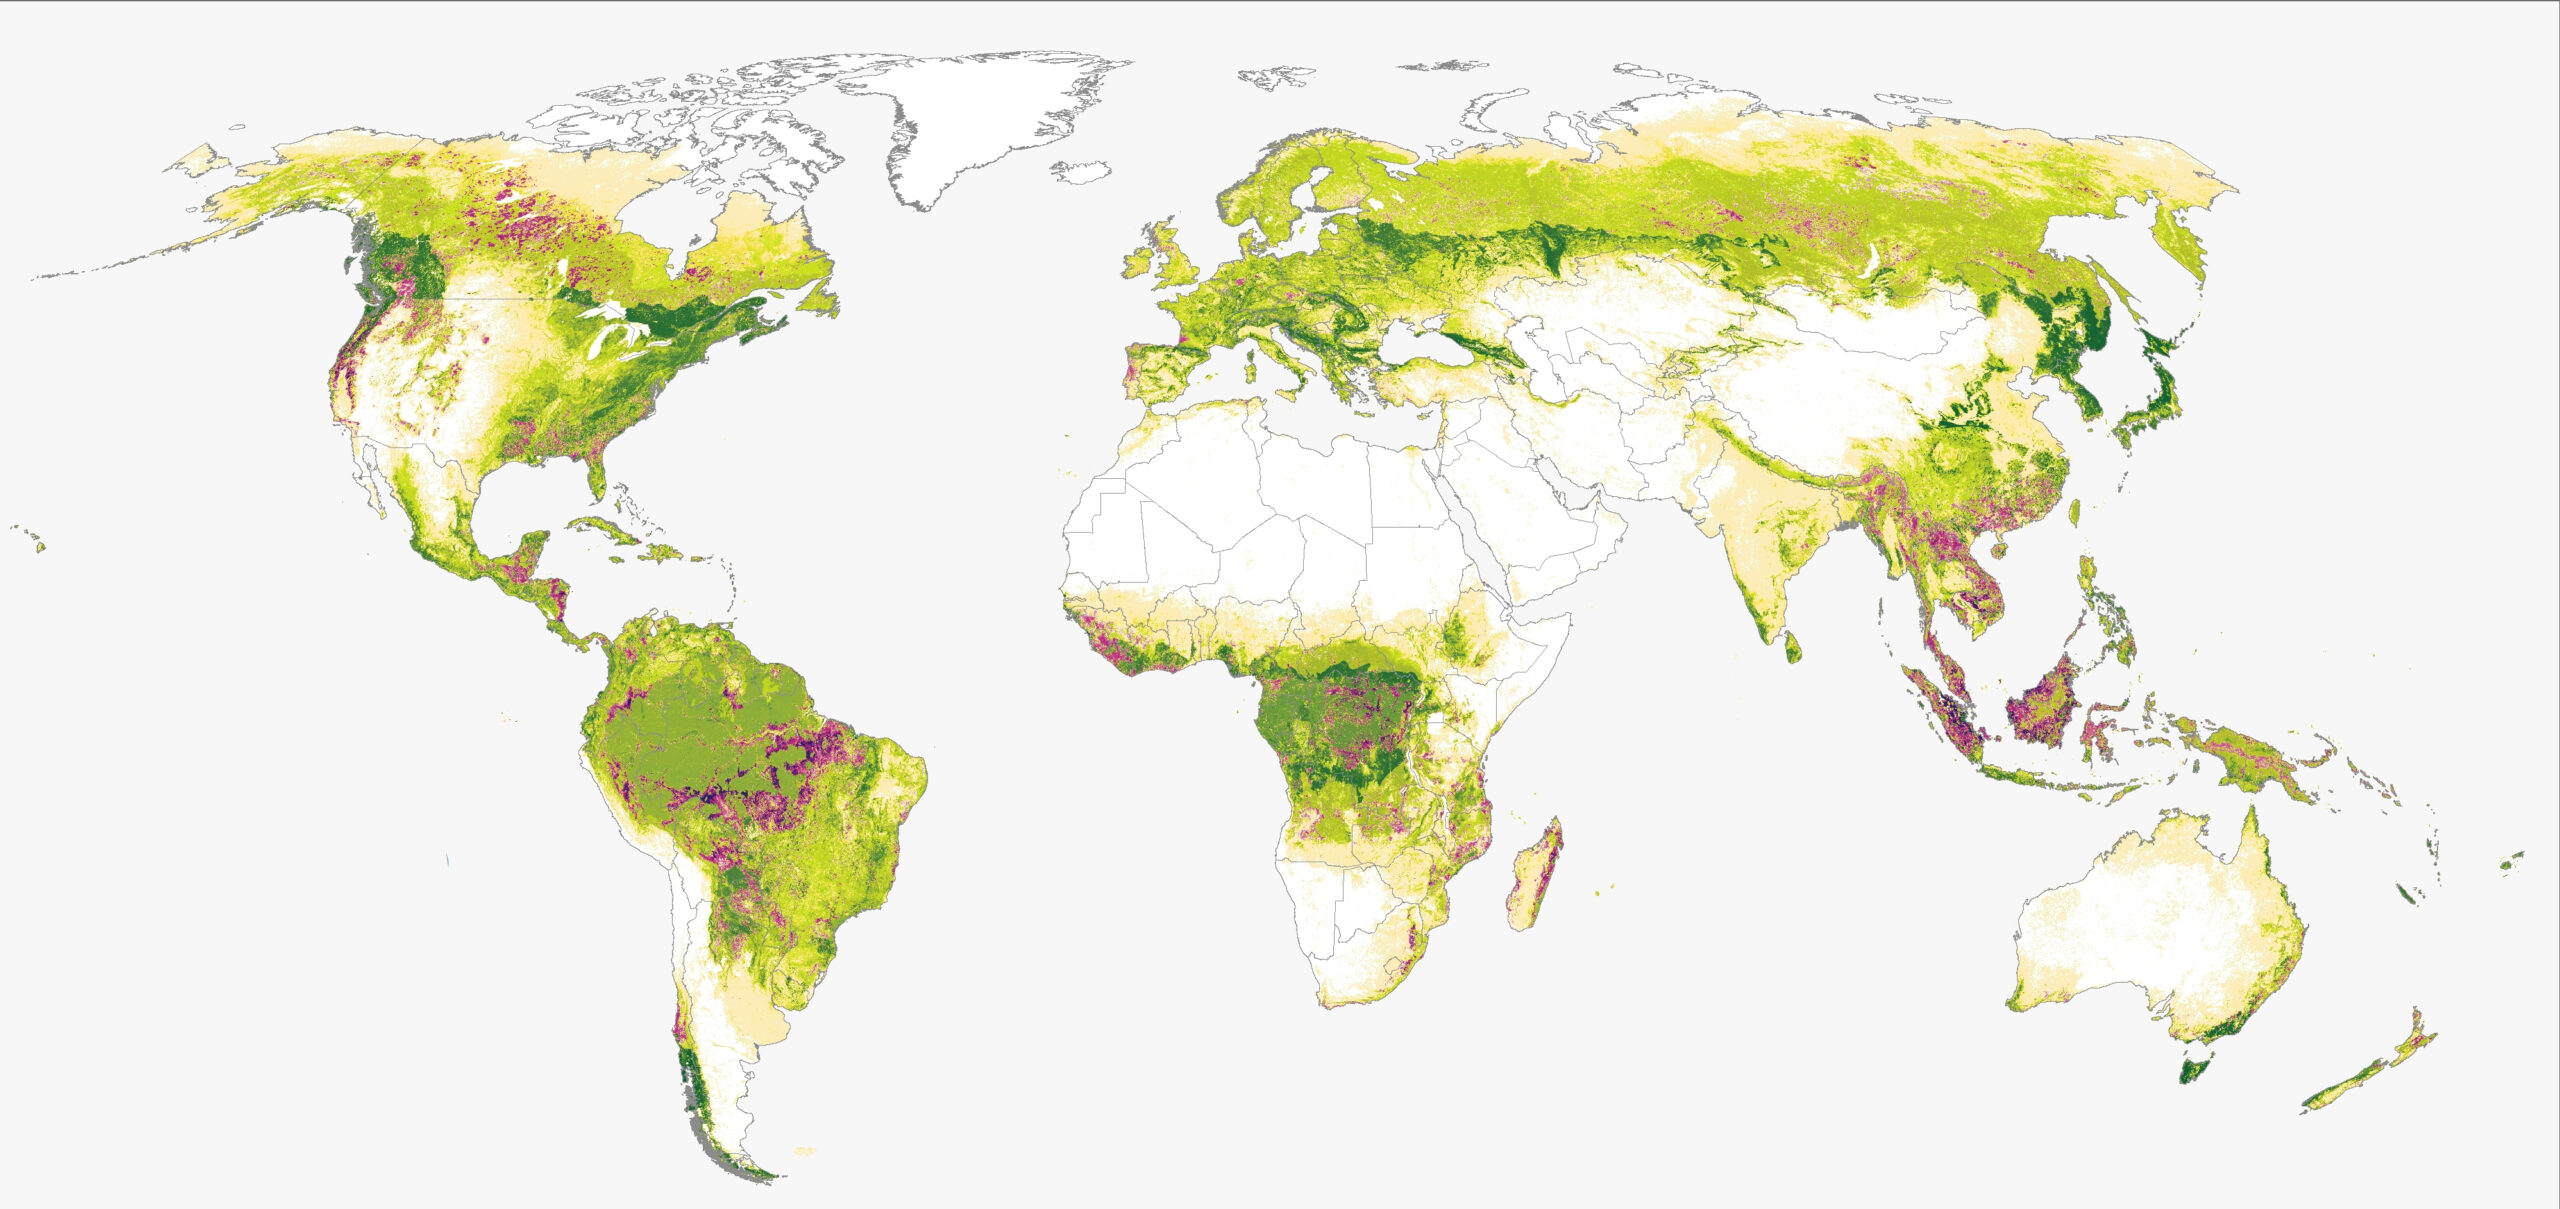
Forests are critical homes to plant and animal species. The Amazon basin of South America, the Congo basin of Central Africa and the tropical rainforests of Southeast Asia hold the highest density of species per unit area in the world. Forests with unique compositions, such as those on isolated islands, host high numbers of endemic species found nowhere else in the world. But any change to these forested habitats can lead to the extinction of the species that depend on them. Information about where these rich biodiverse forests are and the extent to which their landscapes are threatened can help prioritize efforts for conservation and protection. The ability to identify and monitor these areas will aid efforts to minimize human intrusion into intact habitats, facilitate restoration of areas that have been altered and help to measure overall progress towards greater biodiversity conservation. Two new global datasets released on Global Forest Watch (GFW) enable us to say more about where forest biodiversity is located and how it is impacted by human disturbance.
Where is biodiversity most at risk?
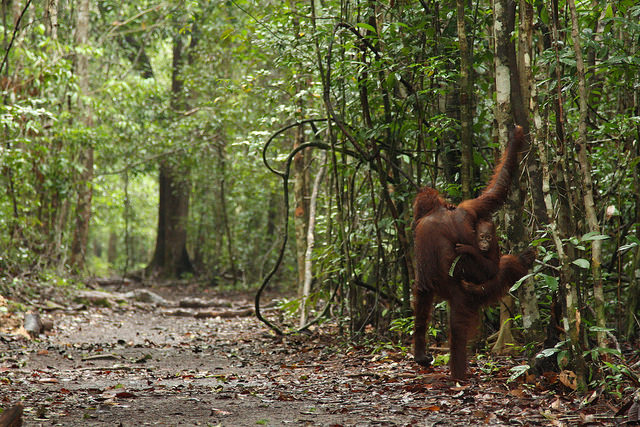
 Orangutans in Indonesia. Photo: Flickr/World Resources Institute.
The new “biodiversity significance” layer on GFW shows a visual representation of how important each pixel on the map is for conserving biodiversity (or how devastating it would be to lose). The layer uses species range data on birds, mammals, amphibians and conifers from the International Union for Conservation of Nature’s (IUCN) Red List, which has a 50-year history of assessing the conservation status of species. The GFW system calculates a “weight” for each pixel on the map based on both the number of overlapping species ranges and the proportion of the global range the pixel represents. This pixel weight therefore reflects the relative “significance” of each pixel for forest species globally. The Leuser Ecosystem in Indonesia is the last remaining place where Sumatran orangutans, elephants, tigers, rhinos and sun bears co-exist naturally. This ecosystem is also home to many species who live almost exclusively within this area, making their global ranges extremely small. Consequently, this unique habitat is shown in dark purple on the GFW map as an example of a location with high biodiversity significance. Indonesia’s species-rich forests are often used to produce palm oil, an ingredient found in a wide range of products from shampoo to doughnuts. The land concessions for oil palm production can be seen all over the country, and unfortunately these concessions often overlap with some of the most important biodiversity habitats in the world. For example, in the map above we see a palm oil concession in orange overlapping with areas of high biodiversity significance in purple.
How are humans impacting biodiversity?
Ecosystems are a delicate balance – often relying on multitudes of species from every level of the food chain to thrive. Disrupting one part of this equilibrium through activity such as deforestation is likely to have cascading effects on the entire community. The “biodiversity intactness” layer displays how close the current ecological community is to its natural state, prior to any human disturbance. This layer is based on models derived from the PREDICTS database, which measures how local biodiversity responds to human pressures. (This dataset only considers the naturally occurring species; for example, if tree cover loss leads to an influx of invasive species but a decline of naturally occurring species, the impact is a negative one.)
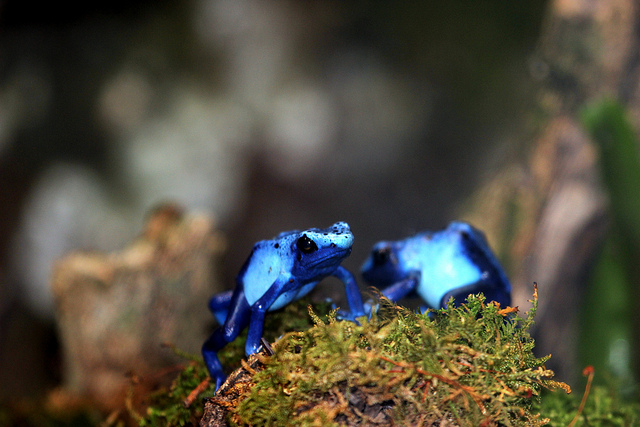 Poison Dart Frog. Photo: Flickr/cuatrok77.
The Brazilian Amazon contains some of the largest and most intact forests in the world. Brazil’s deforestation rates have dropped in recent years, reducing the risk for the species that live there, such as the Sky Blue Poison Frog, by keeping their habitats intact. Unfortunately, previous deforestation in the Amazon has put the recently discovered scarlet-banded barbet species at risk to decline an estimated 13 percent over the next 26 years. However, with well-informed conservation and protection plans, facilitated by mapping initiatives like GFW’s biodiversity layers, this habitat still has a chance to remain close to its natural habitat so that the barbet can thrive. The new GFW data layers allow us to contextualize the biodiversity among GFW’s millions of tree cover pixels and identify areas for urgent action or preservation. Governments will now be able to make more informed decisions when approving concessions or funding conservation projects. Journalists can call attention when the last remaining pixels of a species’ habitat are at risk. Threatened biodiversity around the world now has another voice, in the form of concrete data and visualizations, aiding in their protection. See these data in the context of all forest data on the Global Forest Watch Map here.
