Global Forest Watch’s 2024 Tree Cover Loss Data Explained
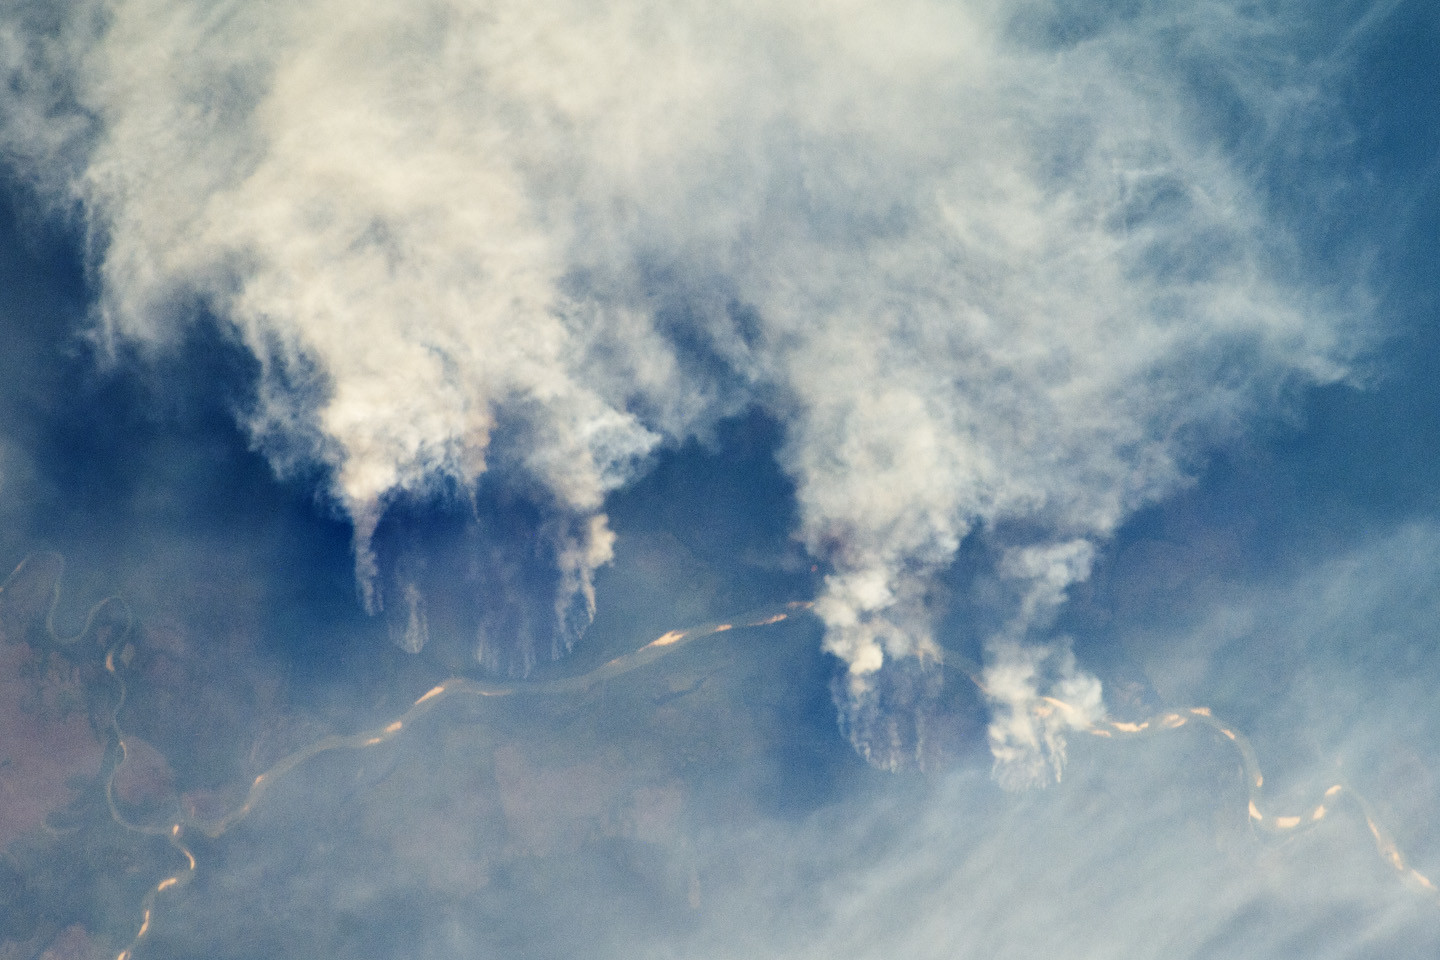
Fires along the Rio Xingu, Brazil. Credit: NASAEarth
New tree cover loss data from the University of Maryland’s GLAD lab (UMD) and available on Global Forest Watch (GFW) shows fires fueled a record-breaking increase in humid tropical primary forest loss in 2024. This year, we saw some differences in estimates between the UMD data and other sources, including official estimates from national monitoring systems. We compare estimates from Brazil, Indonesia, and across the tropics. What does the UMD data measure, what is different this year, and how does it compare to these other official estimates of deforestation? Here is what you should know about the new data.
What does tree cover loss measure and how is this different from deforestation?
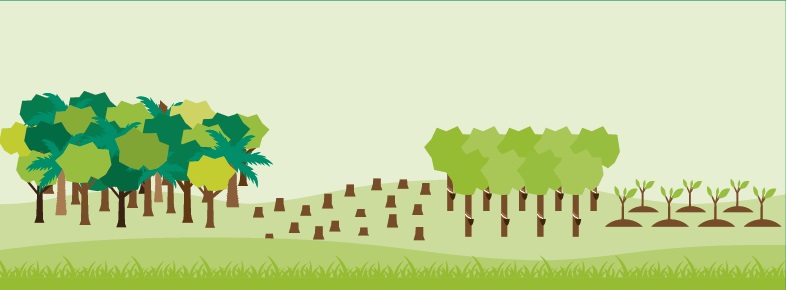
The tree cover loss data from UMD captures disturbances to woody vegetation at least five meters tall for the calendar years between 2001 and 2024. This includes mortality or removal of trees in natural forests as well as in wood fiber or tree crop plantations. However, the humid tropical primary forest data we use to filter the loss in the tropics includes mature natural tropical rainforest and excludes plantations, tree crops and young secondary forests, focusing our analysis away from loss related to harvest or management cycles. Loss of tree cover can be due to human or natural causes and can be permanent or temporary.
Deforestation differs in that it typically refers to a human-caused, long-term change from forest to another land use. Some forms of tree cover loss, such as conversion of a natural forest to agricultural land, are widely considered to be deforestation, while other forms of tree cover loss, such as timber harvesting in plantation forests or natural disturbances, are frequently not — read more about the differences here. Loss of tree cover, whether deforestation or not, can be legal or illegal.
In some cases, such as in the Deforestation and Restoration Targets Tracker on the Global Forest Review, we use a proxy for deforestation. That proxy uses data on the drivers of tree cover loss and includes losses that are from shifting cultivation in humid tropical primary forests and all tree cover loss (inside and outside of humid tropical primary forests) from permanent agriculture, hard commodities (mining or energy infrastructure) and settlements and infrastructure. Temporary losses, such as from fires or logging activities, are not included.
What does tree cover loss from fires include?
The tree cover loss from fire data from UMD distinguishes fire-driven loss from all other tree cover loss by using a model to classify the likelihood of loss due to fire for each 30-meter tree cover loss pixel. The tree cover loss due to fire data includes natural or human-ignited fires that result in direct loss of tree canopy cover. The data captures wildfires, fires used to clear land for another use, and intentionally set fires that result in tree cover loss (including escaped fires started by humans for purposes related to agriculture, hunting, recreation or arson). Instances where trees are first felled and the residue vegetation is later burned are not included since the initial driver of loss is mechanical removal.
This data allows us to better understand how fire impacted tree cover loss in 2024. For example, it was the warmest year on record and Latin America experienced widespread drought, which created hot and dry conditions that fueled the spread of fires across the region. Outside the tropics, Canada and Russia experienced large losses due to fires. Learn more about our findings from the 2024 data here.
In the humid tropics, fires do not occur naturally and are almost always set by humans. Fires often do not result in a permanent change in land use and forests can recover following fires; however, the combined effects of climate change and conversion of forests to other land uses like agriculture — such as warmer and drier conditions — can make this recovery more difficult and increase the risk of future fires.
How does tree cover loss from the UMD data compare to other estimates?
Brazil – PRODES
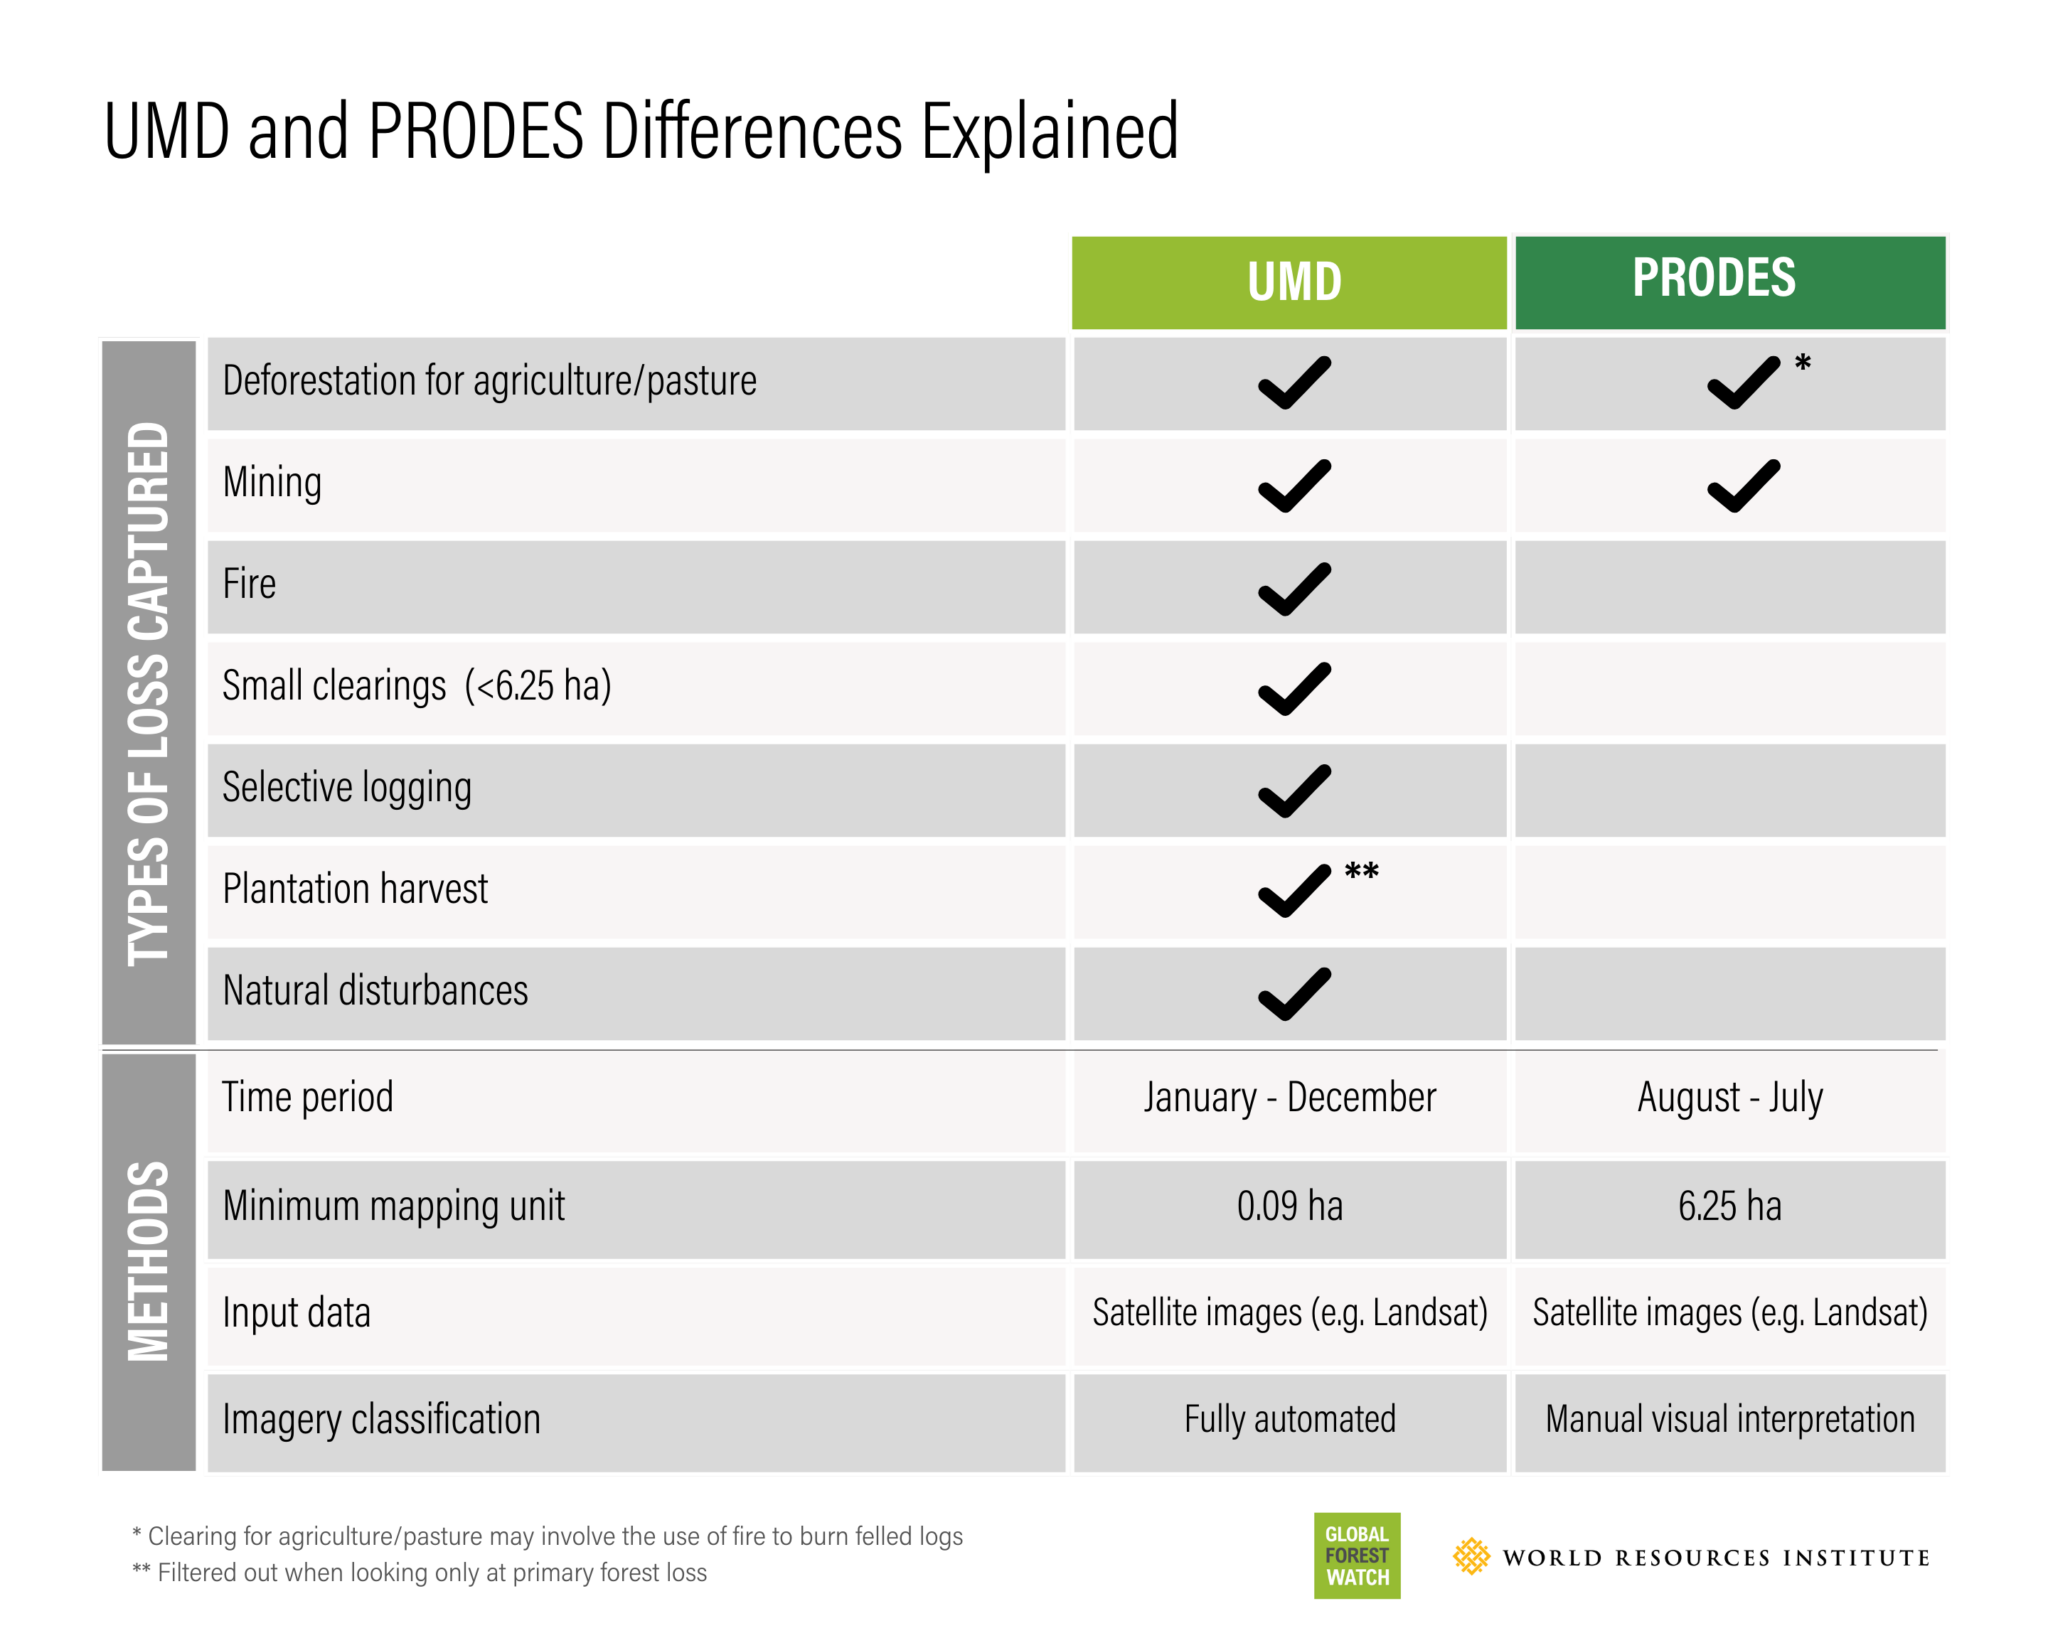
PRODES — the official forest monitoring system for the Amazon from Brazil’s National Institute for Space Research (INPE) — and the UMD data have differences in their definitions and methodologies that are important to understand when comparing them. PRODES measures clear cut deforestation larger than 6.25 hectares (ha), whereas UMD captures any type of loss — both natural and human-caused — larger than 0.09 ha of all trees taller than five meters. These are both important measures that help us understand how forests are changing because deforestation, forest fires and small disturbances to forest canopy can all lead to impacts on climate, biodiversity and ecosystem services.
Another important difference is that the two data sets cover different observation periods. While PRODES includes the 12 months between August to July each year (the latest observation year being August 2023- July 2024), the UMD data includes the calendar year (January – December 2024).
Additionally, INPE has systems that specifically monitor and reports fires (both within and outside forests). For example, INPE’s Queimadas Program monitors active fires and burned areas. INPE’s DETER alerts — which track deforestation and degradation on a daily basis — separate alerts related to wildfires from other forms of degradation and from deforestation.
To see how the results of the two data sets compare, we took a few steps to account for these differences. First, we separated tree cover loss due to fire in the UMD primary forest loss data, which by definition would not be included in the PRODES data. This resulted in closer estimates between the two data sets, though they still show different trends for the latest year of data: while PRODES estimates a 31% decrease in deforestation in the Brazilian Amazon between 2023 and 2024, UMD non-fire primary forest loss shows a 13% increase.
Second, we accounted for the 6.25-ha minimum mapping unit used by PRODES. We applied a 6.25-ha minimum mapping unit to the UMD annual non-fire primary forest loss to separate loss areas into patches smaller than 6.25 ha, and greater than or equal to 6.25 ha. When accounting for patch size, the UMD non-fire primary forest losses greater than or equal to 6.25 ha declined by 2% between 2023 and 2024, showing a downward trend like the PRODES data; conversely, non-fire primary forest losses smaller than 6.25 ha increased by 30% between 2023 and 2024.
UMD and PRODES data in the legal Amazon
Further differences between the two data sets are likely due to the differences in methodology used to detect changes and the differences in observation periods. In the case of methodological differences, the UMD data is produced by using an automated algorithm to detect change at the 30-meter pixel scale, while the PRODES data is produced through manual visual interpretation of satellite imagery. In the case of the different observation periods, the PRODES period ends in July, just before the height of the dry season in the Amazon, which runs June to November and tends to see increased forest clearing and fire activity. Thus, the PRODES data may not include loss captured in the UMD data later in the year. For example, the Brazilian government’s DETER alerts — which track deforestation and degradation on a daily basis — capture spikes in deforestation, forest degradation and fire activity (including both within and outside forests) during the dry season.
Brazil – MapBiomas
MapBiomas Brazil is a network of NGOs, universities and technology startups that develop annual maps of land cover and land use, as well as various monthly monitoring and alert products. Since 2019, they have produced annual reports on deforestation in Brazil through an initiative called MapBiomas Alerta. The data is produced by combining deforestation alert data from various independent (e.g., SAD) and official (e.g., DETER and PRODES) monitoring systems and then validating and refining the spatial boundaries of these alerts through visual inspection of high-resolution satellite imagery.
MapBiomas Alerta and the UMD data have important differences in definitions and methodologies that affect how they measure forest loss in Brazil. The MapBiomas data focuses only on the complete removal of native vegetation (including forests, savannas and grasslands) and excludes losses from fire, selective logging and other forms of partial disturbance, whereas the UMD data includes all types of tree cover loss greater than 0.09 ha regardless of driver, including both natural and human-caused events. Additionally, UMD uses a fully automated algorithm to detect change, while MapBiomas visually verifies and refines alerts from various systems that use different detection methods.
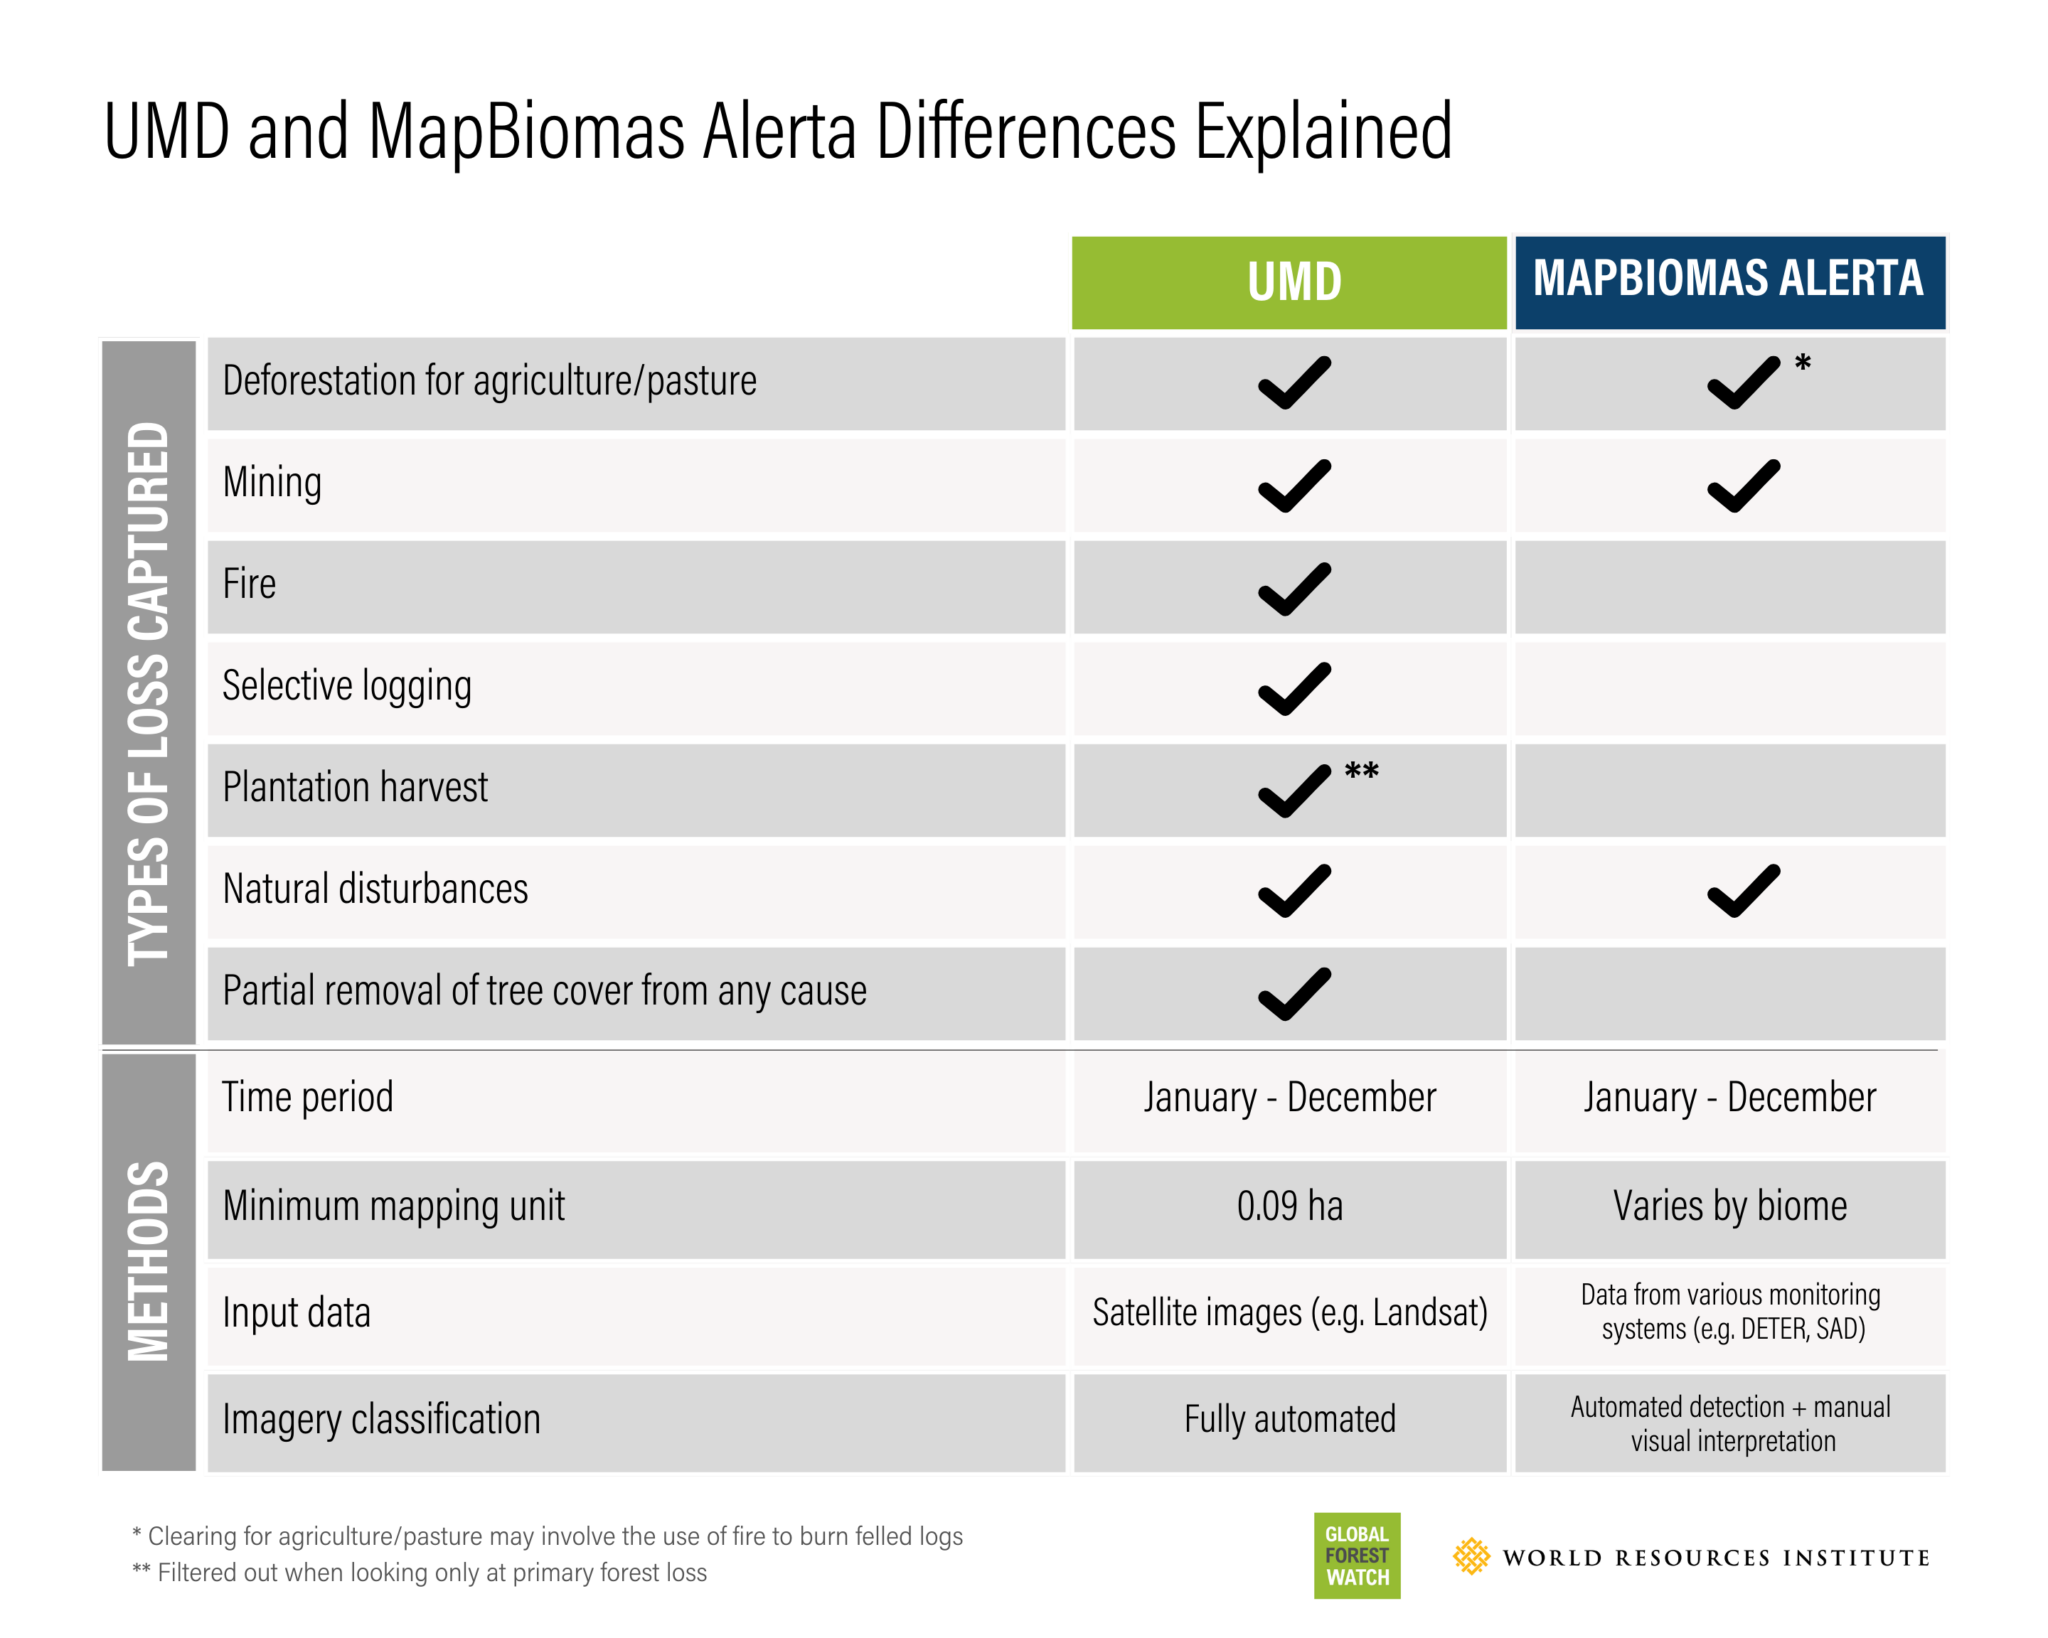
As with the PRODES data, we took a few steps to account for differences between the UMD data and the MapBiomas Alerta data before comparing them. First, we used a 10% canopy density threshold — rather than the 30% threshold we typically use for most countries in our analysis — to account for losses in Brazil’s sparsely treed ecosystems, which are included in the MapBiomas data, and used the natural vegetation classes in the MapBiomas Brazil 2022 land cover map as the baseline for the analysis. Second, we used our new data on drivers of tree cover loss to separate out losses due to logging and wildfire, which are not included in the MapBiomas data.
After removing tree cover loss from logging and wildfire, the UMD data shows a small increase in tree cover loss between 2023 and 2024, and estimates are closer in magnitude to the MapBiomas results.
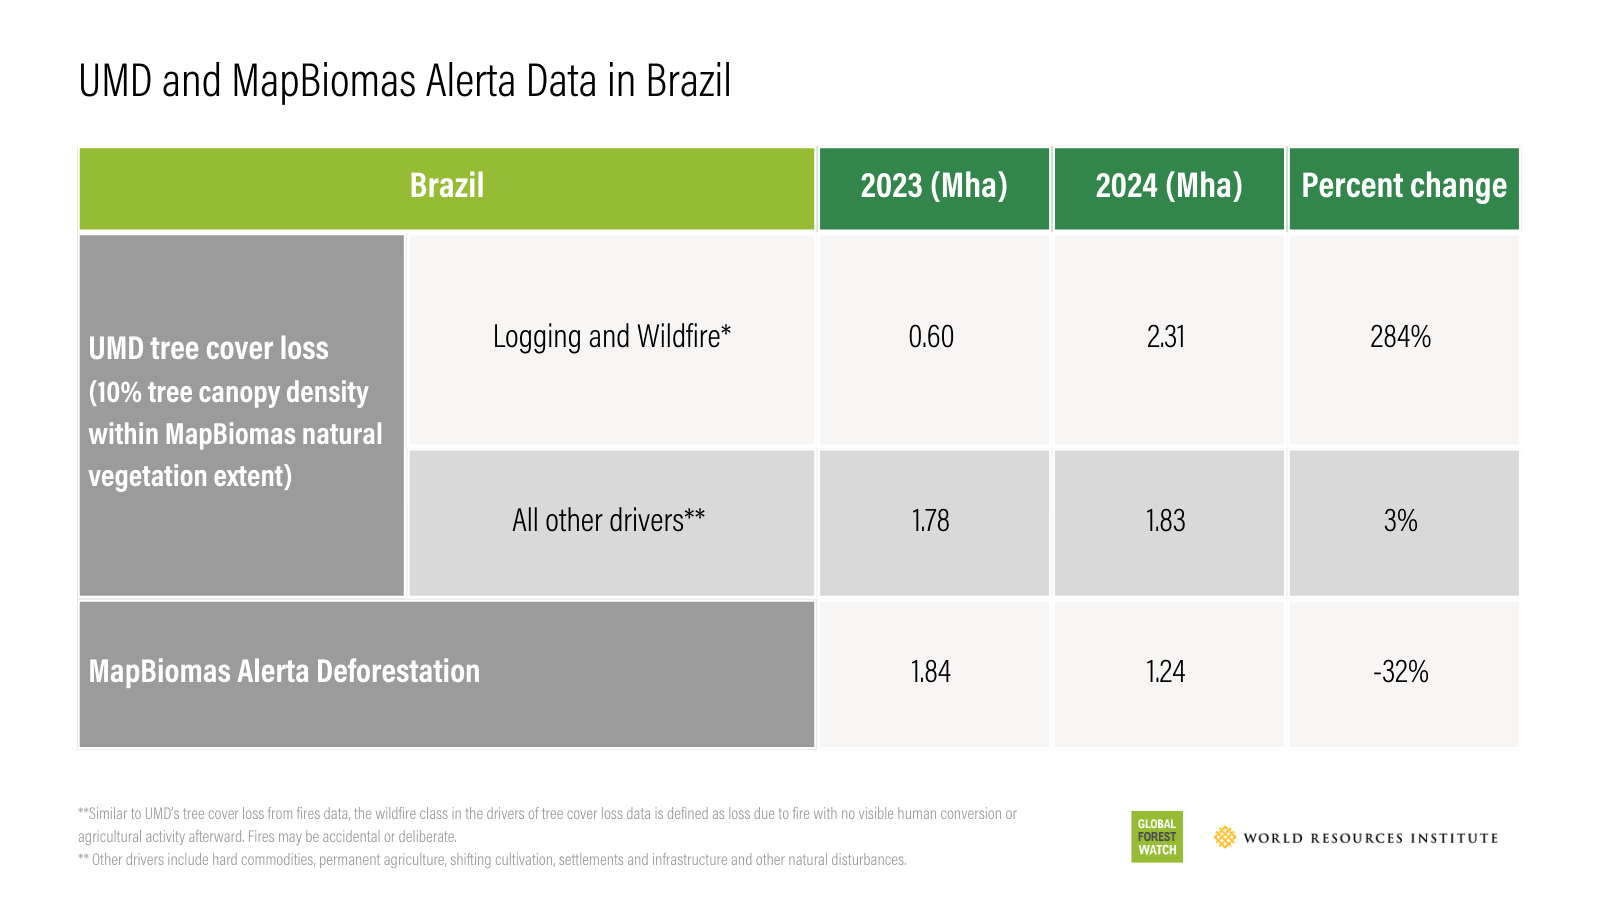
Because MapBiomas does not include fire-related forest loss, which is increasingly prevalent in Brazil, it underrepresents a growing share of total forest change. Combining both data sets can therefore provide a more complete understanding of forest dynamics in the country.
Indonesia – SIMONTANA
As with PRODES, there are several key differences between the official deforestation data provided by the Indonesian Ministry of Forestry through the National Forest Monitoring System (SIMONTANA) and the UMD data that are important to consider when comparing the two. SIMONTANA defines deforestation as the conversion of primary, secondary or plantation (e.g. pulp and paper) forest to non-forest, using a minimum area of 6.25 ha. The data is produced through manual visual inspection of satellite imagery. SIMONTANA uses an observation period of July- June (the latest observation year being July 2023- June 2024) rather than the calendar year.
For 2024, SIMONTANA estimated gross deforestation of 216,200 ha, an increase from 133,800 in 2023. The data also accounts for reforestation (40,800 ha) to report net deforestation of 175,400 thousand ha in 2024. The UMD data, on the other hand, estimates 258,800 of primary forest loss in 2024, a higher estimate than SIMONTANA and an 11% decrease from 2023.
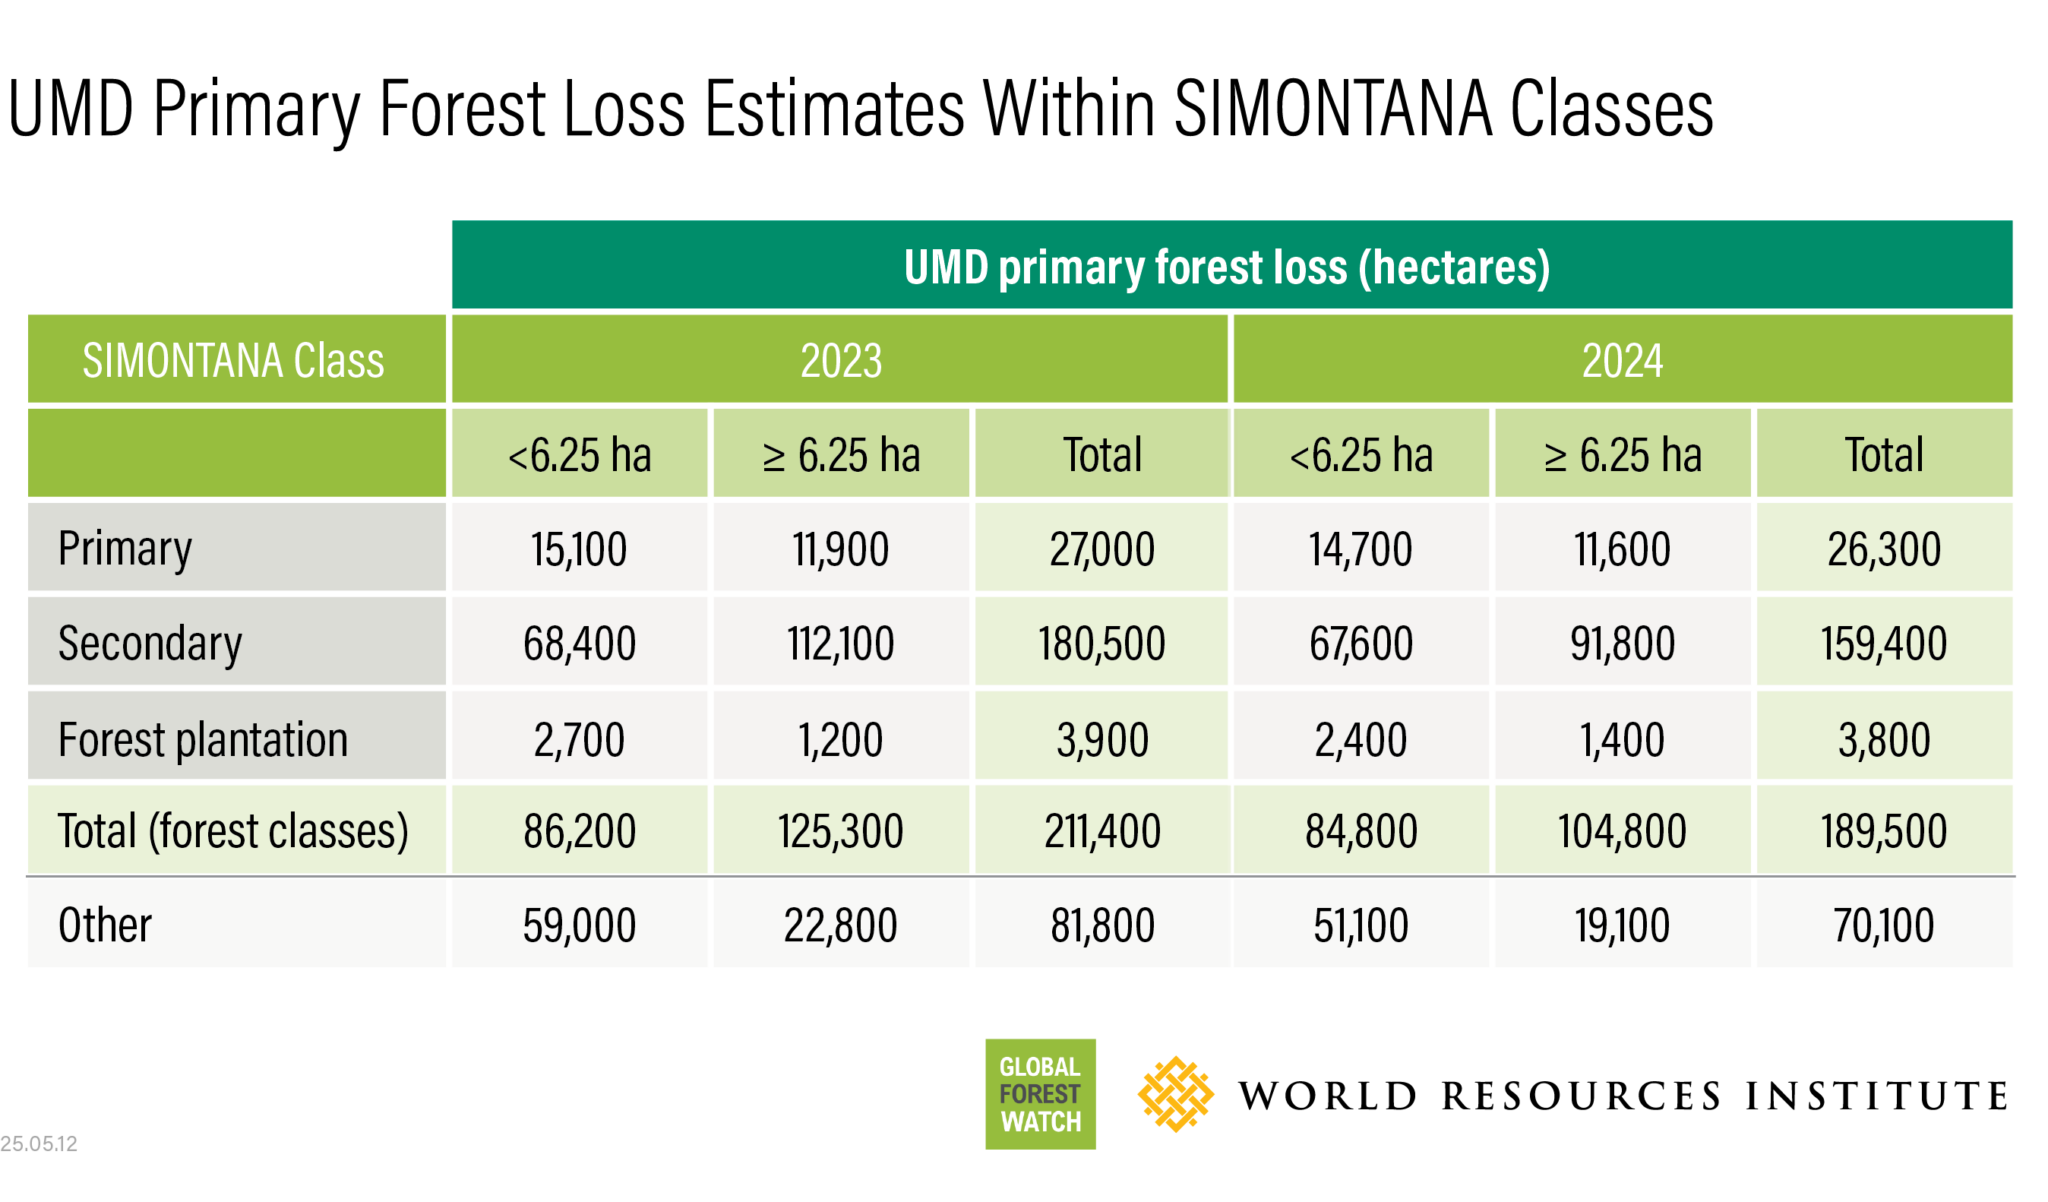
To better compare the UMD and the SIMONTANA data, we used the SIMONTANA Land Cover Map from 2021 as a baseline and applied a 6.25 ha minimum mapping unit to the UMD tropical primary forest loss data. The total UMD tropical primary forest loss in 2024 within the SIMONTANA forest classes was 189,500 hectares, which is closer but slightly lower than the SIMONTANA gross deforestation estimate of 216,200 ha, yet still a decrease from 2023.
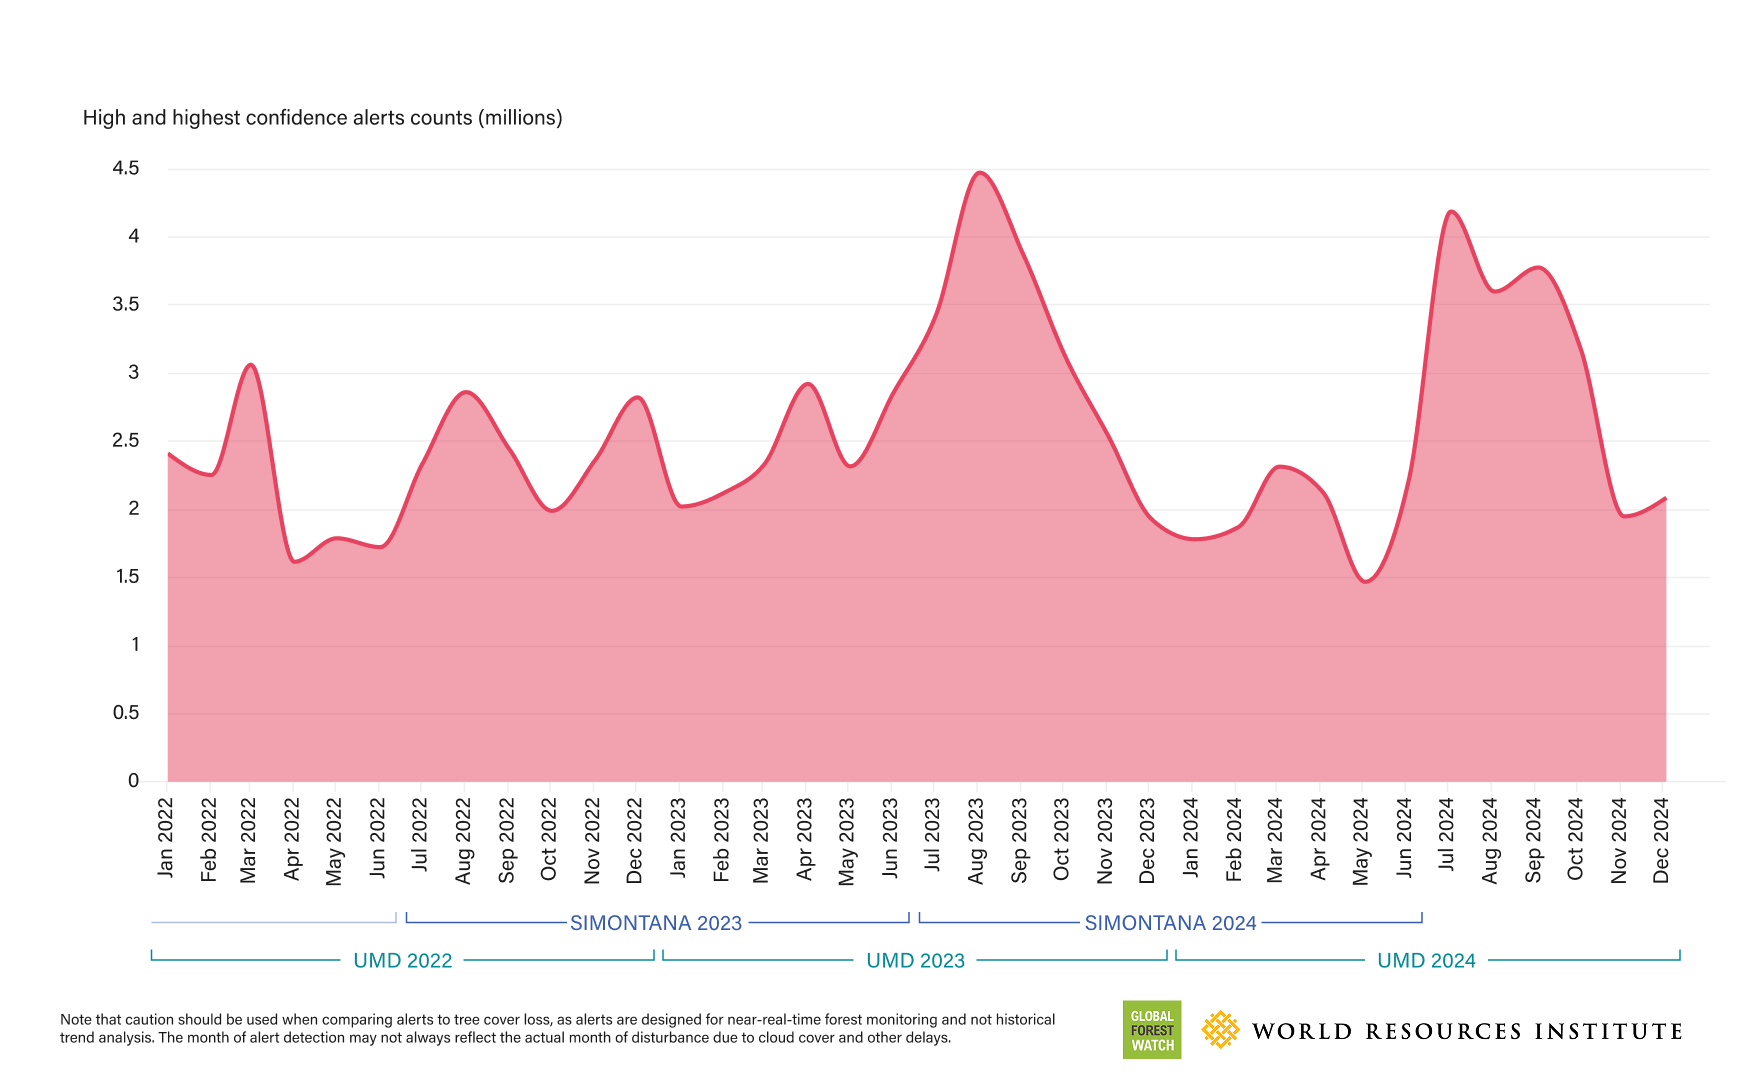
The difference in observation periods may explain the difference in trends between 2023 and 2024 in the two data sets. Looking at the integrated deforestation alerts available on GFW within tropical primary forests in Indonesia provides an indication of the timing and magnitude of disturbances throughout the year. GFW’s integrated deforestation alerts showed a 6% increase in total alert count between July 2022 to June 2023 compared to July 2023 to June 2024 (corresponding with SIMONTANA’s observation periods), but a 10% decrease in total alert count between the 2023 and 2024 calendar years (corresponding to UMD’s observation period).
Integrated deforestation alerts in tropical primary forest in Indonesia
Indonesia – Auriga Nusantara
Auriga Nusantara is an environmental non-profit in Indonesia that monitors changes to forest cover in Indonesia and coordinates the MapBiomas initiative for the country. It monitors and reports the loss of natural forest cover, which includes primary and secondary forests but excludes timber plantations and plantation forests. The data is produced by combining suspected deforestation from UMD deforestation alerts and change detection using 5-meter Planet satellite imagery and performing visual inspection of polygons greater than 1 ha to verify if deforestation occurred.
Like the other data sets discussed in this blog, the Auriga Nusantara data and the UMD data use different methods, and in this case, different satellite imagery sources that have different spatial resolutions, which can lead to differences in the estimates.
Estimates from the Auriga Nusantara data and the UMD data are generally aligned: Auriga Nusantara estimated 261,600 ha of deforestation, just slightly higher than the 258,800 ha of tropical primary forest loss detected by the UMD data. However, Auriga Nusantara reports a 2% increase in deforestation between 2023 and 2024, while the UMD data shows an 11% decrease. The different trends may be due to the different methods that result in slight differences in estimates between years. For example, there is variation between the two data sets in the year of attribution for the same loss events: we overlaid the two data sets and found that approximately 10% of the Auriga Nusantara 2024 deforestation area was detected as loss in 2023 by the UMD data, while approximately 6% of the Auriga Nusantara 2023 deforestation area was detected as loss in 2024 by the UMD data.
JRC Tropical Moist Forest
The Tropical Moist Forest (TMF) data set by the European Commission Joint Research Center (JRC) monitors forest change in the tropics. Like the UMD tree cover loss data, the JRC TMF data uses Landsat imagery to map forest disturbances annually at the 30-meter pixel scale. However, there are some key differences between the data sets — read our in-depth comparison here.
In general, the JRC TMF data detects a larger area of disturbances than the UMD tropical primary forest loss data because its degradation classification includes disturbances that do not meet the definition of loss used in the UMD data, such as clearing of less than half of the tree cover in a 30-meter pixel or disturbances detected over a very short period.
After separating the UMD tropical primary forest loss due to fire — since fires are classified as forest degradation in the JRC TMF data — the UMD non-fire tropical primary forest loss estimate in 2024 (3.5 million hectares) is higher but similar in magnitude to the JRC TMF total deforestation estimate (3.1 million hectares). It’s important to note, however, that the distinction between JRC TMF’s degradation and deforestation data for 2024 is not yet fully consolidated because insufficient time has passed to confirm post-disturbance forest recovery or disturbance permanence.
Despite this, the trends in the two data sets are generally aligned in recent years, including in 2024. Comparing total forest disturbances between the two data sets shows that both estimate a large increase in disturbances between 2023 and 2024 — JRC TMF data saw a 78% increase in total forest disturbances across the tropics, similar to the 80% increase seen in the UMD primary forest loss data.
UMD and JRC forest disturbances in the humid tropics
Why do we focus on the tropics?
In our analysis of the UMD data, we largely focus on tree cover loss in humid tropical primary forests because tropical forests experience the vast majority (94%) of the world’s deforestation, and loss in those areas has huge impacts on biodiversity and carbon storage. Even if these losses are eventually reversed, it will take decades for these habitats and carbon stocks to recover, and permanent biodiversity loss may occur.
Data improvements over time can affect comparability between years
Algorithm adjustments and better satellite data have improved the tree cover loss data set over time. The original algorithm used to map tree cover loss has been improved in subsequent updates for the years 2011-2014 and 2015 onwards, and Landsat 8 was incorporated in in 2013, which has an improved sensor that can better resolve features on the ground. Together, these improvements have resulted in increased sensitivity in detecting changes such as selective logging, small-scale shifting cultivation and fires. Variations in satellite image availability (which has generally increased over time) also mean there are inconsistencies with the quality and number of images available to capture data each year.
To address these inconsistencies, we:
- Focus our analysis on trends post-2015 since there have been minimal changes to the methods and satellite data since then
- Assess the three-year moving average to interpret long-term trends
- Disregard the increase in loss post-2012 in places likely to be impacted by these changes, like Central Africa
This year, like last year, the loss detection algorithm used by the University of Maryland to create the tree cover loss data set was supplemented by information from the DIST-ALERT land disturbance data set. Late season changes are sometimes missed in the tree cover loss data due to insufficient satellite data and cloud cover and are attributed to the following year. The annual DIST-ALERT composites showed patches of tree cover loss that were originally missed by the tree cover loss data, including late season fires in boreal forests and recent mining, and these were manually reviewed and included for 2024.
Explore More Articles
Looking for the Quickest Signal of Deforestation or Vegetation Disturbance Globally? Turn to GFW’s Integrated Disturbance Alerts
GFW’s integrated alerts layer combines the power of four alert systems for an improved view of deforestation and other vegetation disturbances globally.