What’s New With GFW’s Forest Carbon Monitoring
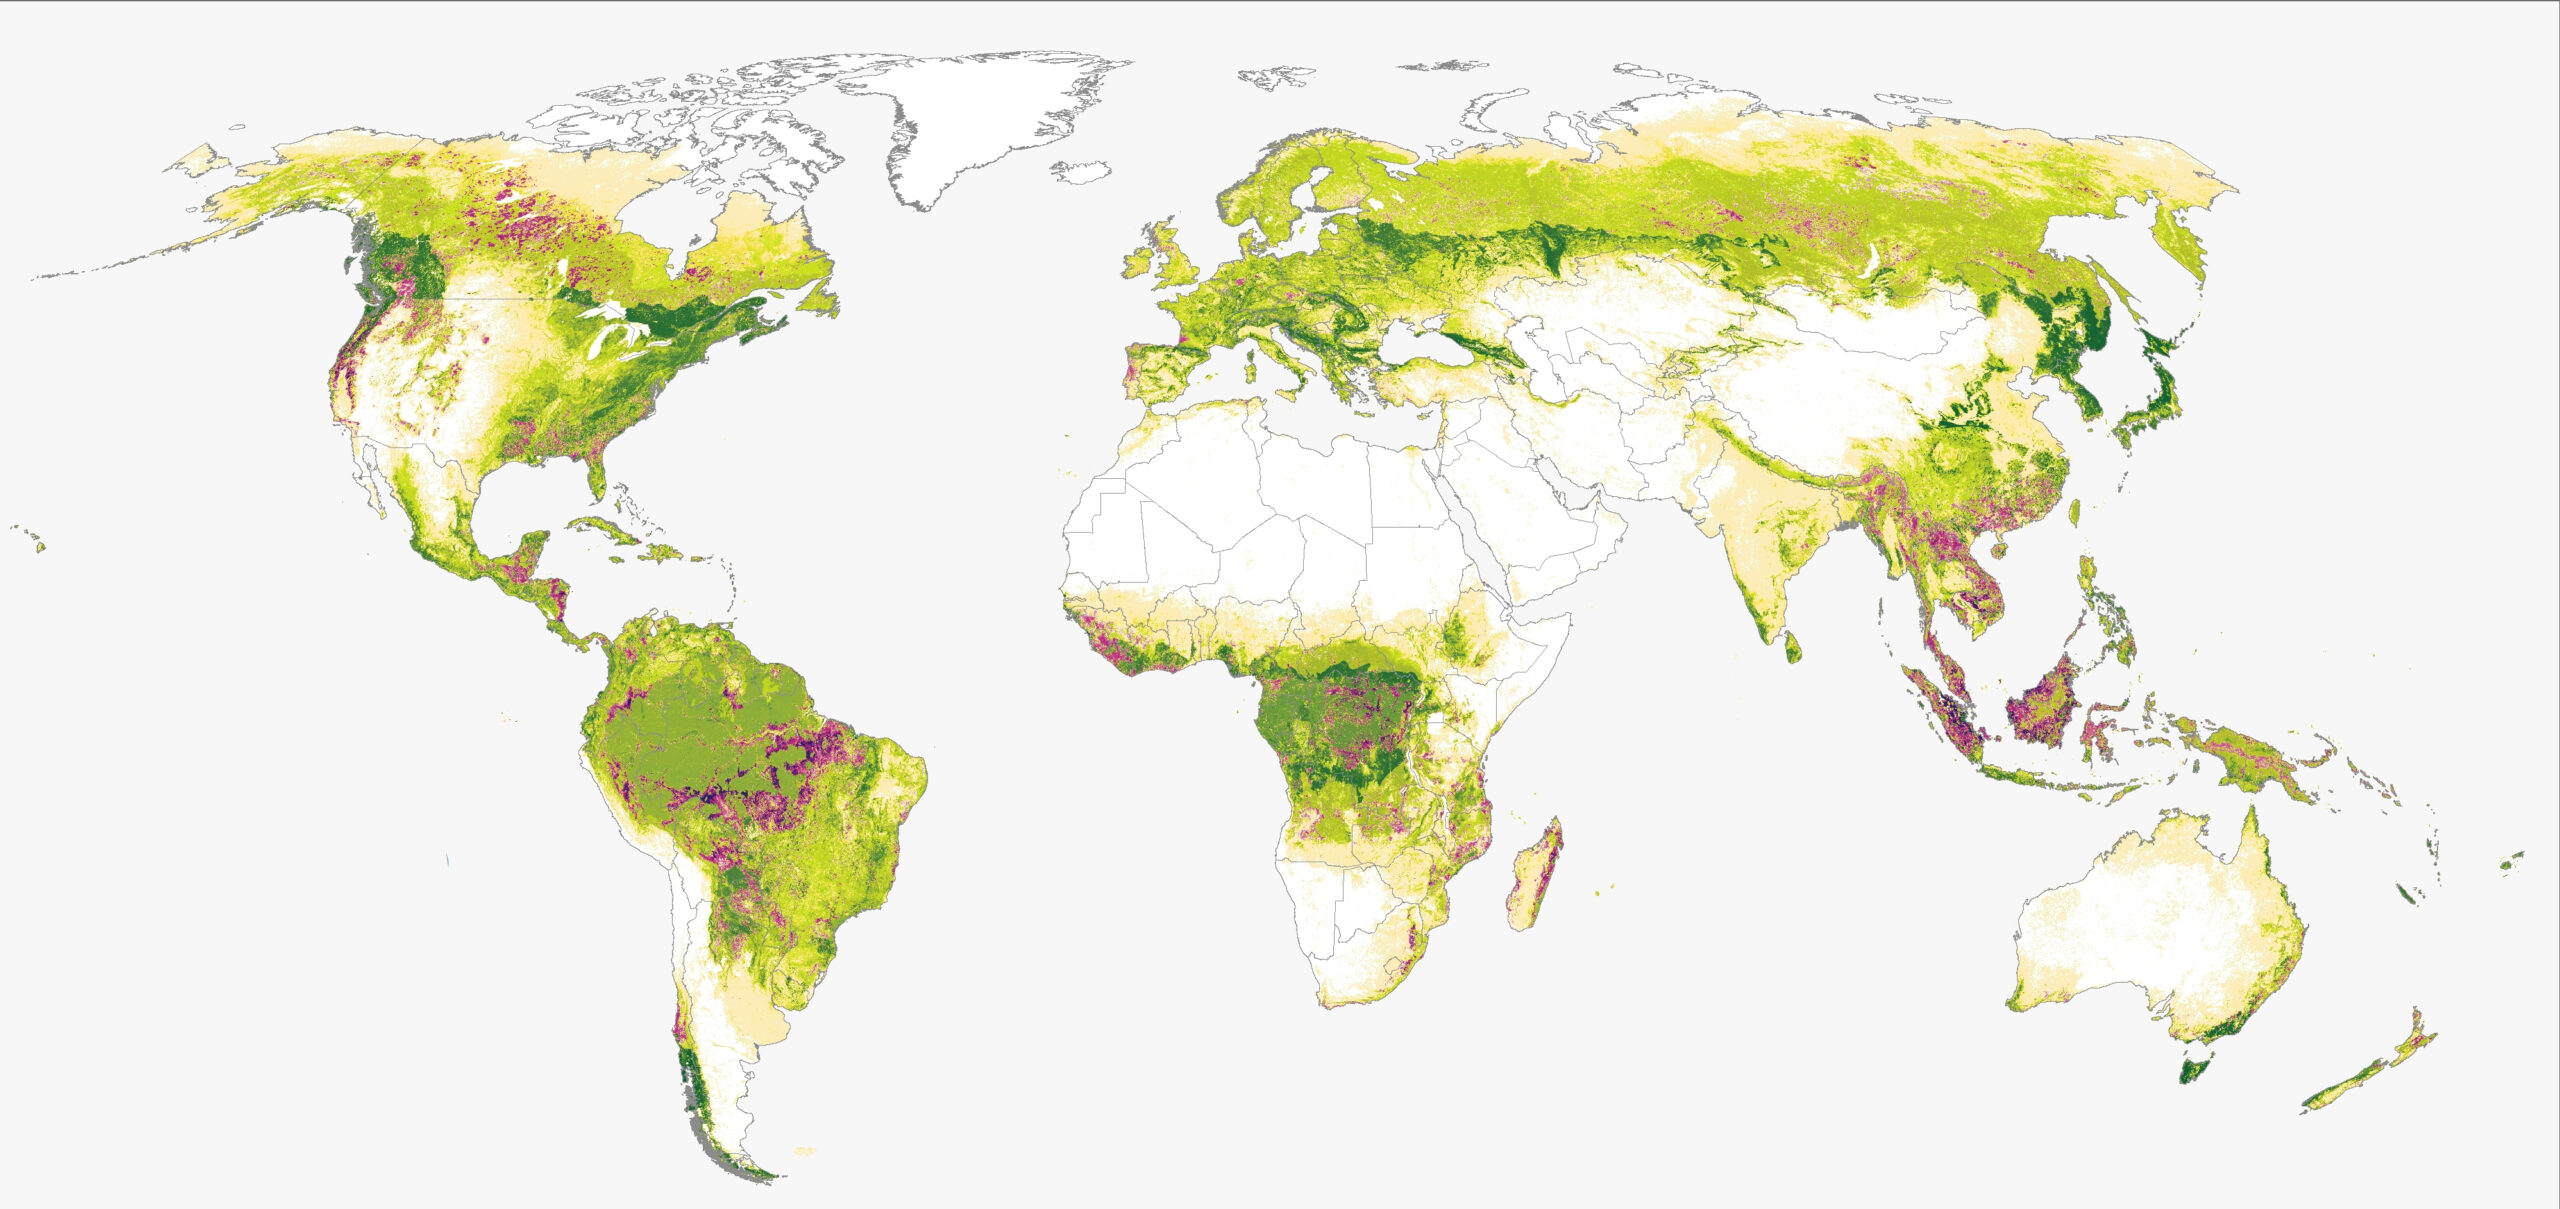
Net forest greenhouse gas flux 2001-2022
The Intergovernmental Panel on Climate Change’s (IPCC) Sixth Assessment Report reminds us that forests play a crucial role in the global carbon cycle and mitigating climate change. To act on that report and manage and protect forests — from policies to on-the-ground action — governments, companies, Indigenous Peoples and civil society need information on where forests are gaining or losing carbon.
To support these groups and others, Global Forest Watch (GFW) released maps and associated statistics of forest greenhouse gas emissions, sequestration (forest carbon removals) and net greenhouse gas flux (the difference between them) in 2021 based on a geospatial framework designed to be improved over time as relevant new data and information are produced. Since the framework’s original publication, we have updated it and associated maps and statistics available on GFW as each new year of tree cover loss data is released.
In addition to the standard update of tree cover loss data, we have made other improvements to the framework’s inputs using recently available geospatial data. Read on for a summary of all the changes since 2021 — including the latest updates since our journal article (which only captures changes through 2024) — and what’s next for GFW’s global forest carbon monitoring.
What is GFW’s forest carbon flux monitoring framework and how has it been used?
GFW’s geospatial forest carbon flux monitoring framework is based on the land use, land-use change and forestry part of the Agriculture, Forestry and Other Land Use (AFOLU) guidelines developed by the IPCC, which all national governments use for their greenhouse gas inventory reporting. However, rather than relying on statistical data on forests like most national governments do, the framework takes a geospatial approach by combining multiple relevant Earth observation data sets to derive estimates about how each 30×30-meter piece of forest has contributed to global carbon emissions and removals from 2001 onwards. Read more about the framework and how it works here.
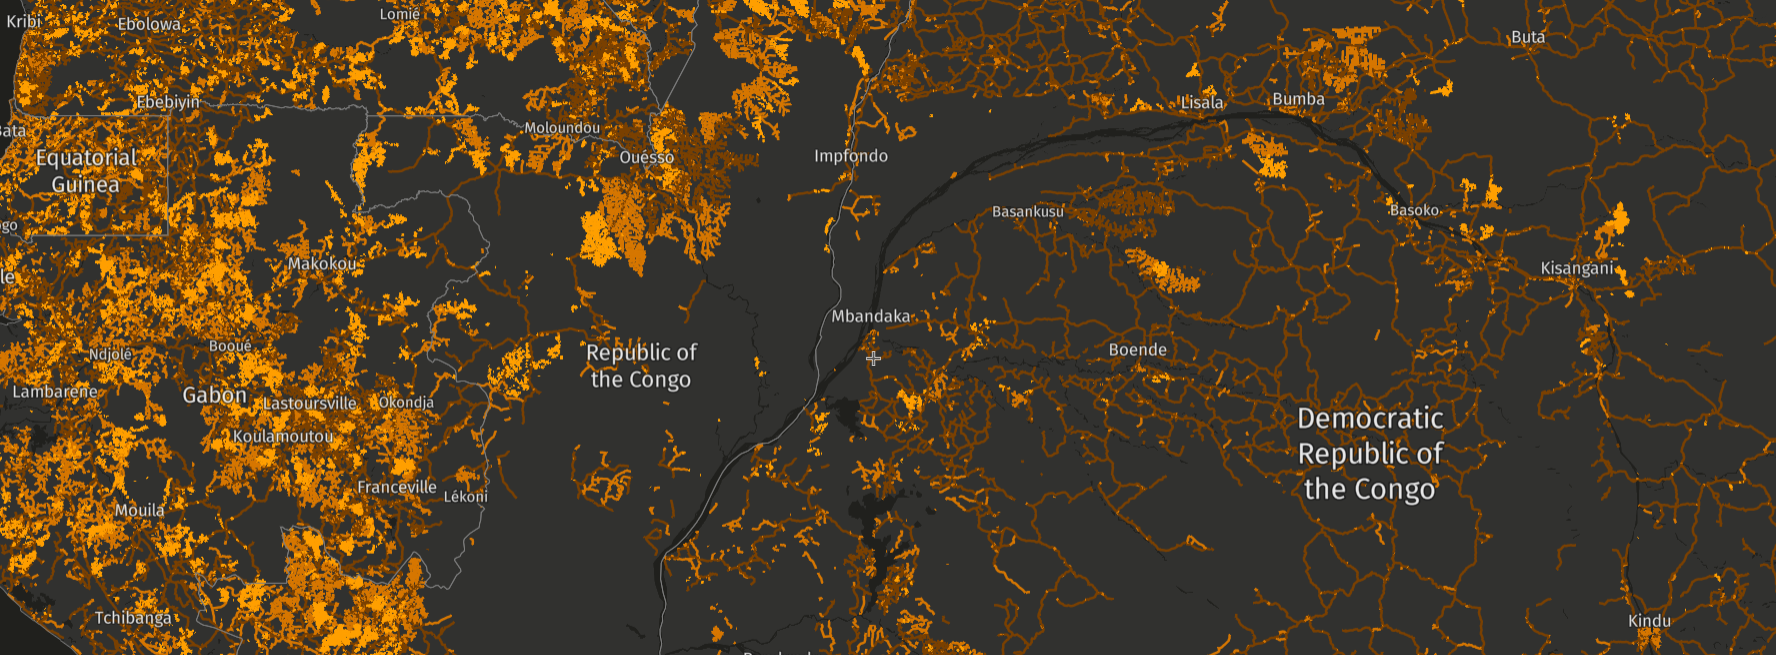
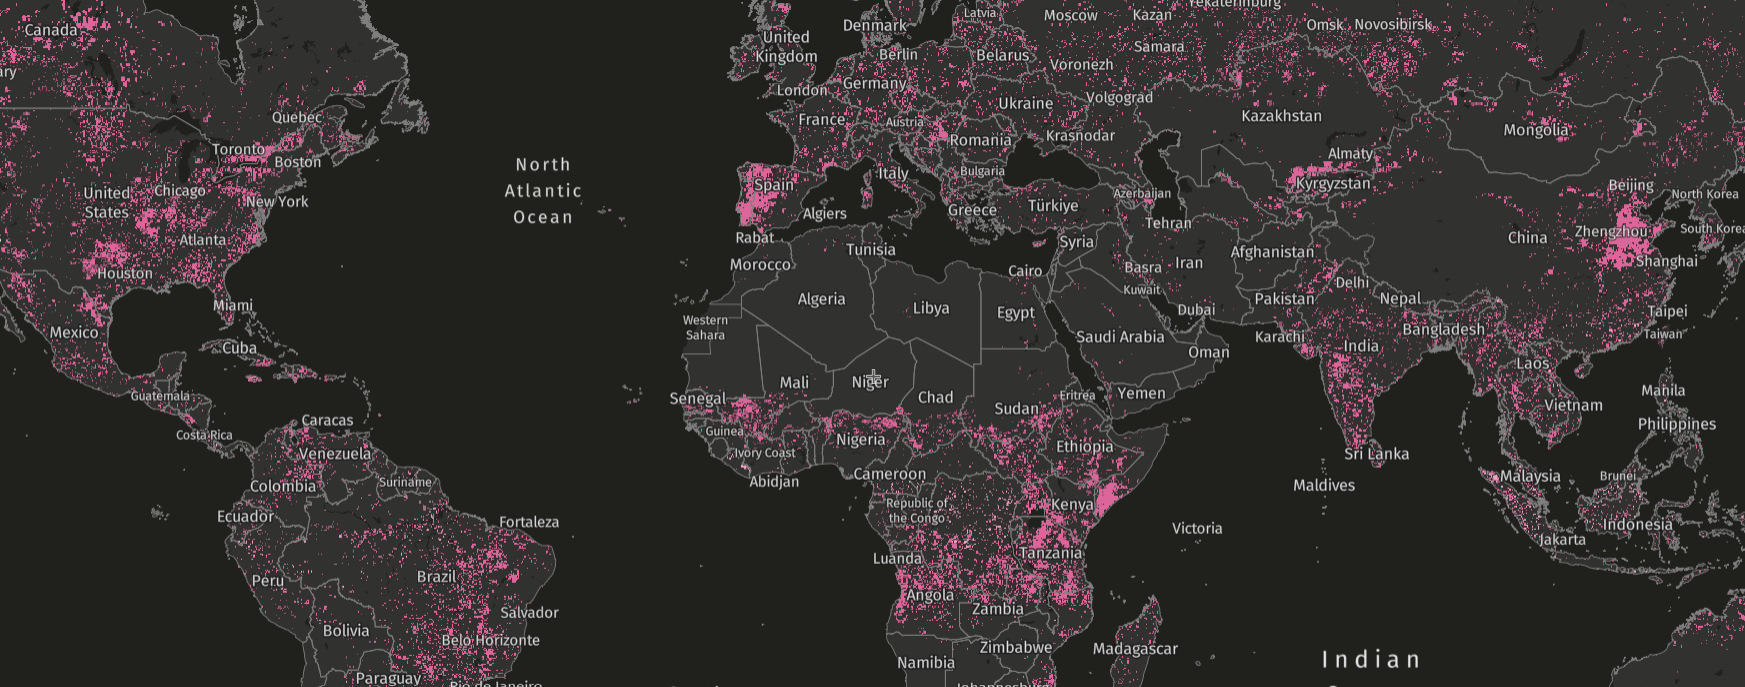
The carbon flux data, showing emissions, removals and net flux, is available on the GFW map and is updated annually
Many actors and organizations have used GFW’s forest carbon data to monitor carbon fluxes, for example, in UNESCO World Heritage sites; in forests managed by Indigenous Peoples; to assess the status of the Amazonian forest carbon sink; by companies for their greenhouse gas inventories; for tracking global commitments; in the IPCC Sixth Assessment Report; in scientific research and more.
Additionally, we “translated” the gross emissions and removals estimates from the GFW forest carbon framework into the reporting categories that countries use when they submit national greenhouse gas inventories to the United Nations, allowing for more transparent and aligned comparisons across different data sources. Read a more here and view the data here.
Updates to the forest carbon flux monitoring framework
We designed the forest carbon monitoring framework with the flexibility to incorporate scientific and technical advances in geospatial data to ensure that it continues to be based on the best available data. Since the initial publication, we have updated several aspects of the framework. Some of these address limitations in the original analysis, others bring the framework in line with recent scientific advances and others reduce uncertainty in parts of the framework. All changes apply to the entire time series, going back to 2001.
Along with our annual updates to tree cover loss, we have made many other updates to the model:
1. Locally variable root biomass. The framework uses a global 30-m aboveground woody biomass map for the year 2000 as the basis for estimating biomass in tree roots (belowground biomass), and values for both aboveground and belowground biomass are used as the starting point for mapping emissions and removals from 2001 onwards. The framework originally assumed that belowground biomass was 26% of aboveground biomass (also known as the root-shoot ratio) for all forests outside of mangroves,* regardless of forest type or climate. However, the root-shoot ratio can vary significantly depending on forest type and climate.
The framework now uses a wall-to-wall map of the ratio of belowground to aboveground biomass, with values that range from less than 15% to more than 150%. This update improves local estimation of belowground biomass and thus carbon emissions and removals. While using this new root-shoot ratio map should not substantially impact global estimates, the update will improve local estimation of belowground biomass in places where the root-shoot ratio is significantly different from the global average.
2. Updated tree cover gain through 2020. While the original framework only included tree cover gain between 2000 and 2012, it now includes tree cover gain through 2020. This improves emissions and removals estimates because tree cover gain is now monitored over nearly the entire period of analysis. Although tree cover gain since 2020 is not captured by the framework — nor is information on the individual years in which tree cover gain occurred — up-to-date, annual tree cover gain data is under development and will be incorporated into the framework when it becomes available.
3. Higher resolution forest fire data. The framework originally attributed tree cover loss due to fires using a 500-m MODIS burned area product. We have replaced this with 30-m data on tree cover loss due to fires from the University of Maryland (UMD), which is a subset of the tree cover loss data that the framework uses. We made this change because, unlike the MODIS burned area product, the new data from UMD is trained specifically to detect fire-related tree cover loss, although it does not capture all fires. This difference, combined with the higher spatial resolution of the tree cover loss due to fire data, captures fire activity more precisely and, therefore, improves our estimates of carbon emissions associated with forest fires.
4. Updated peat extent. We improved the global peat map used in the framework by incorporating recently published regional maps. These increased peat extents in the Congo Basin, lowland Peruvian Amazon and non-tropical areas should more accurately reflect the extent of emissions from peat drainage, where relevant.
5. Updated Global Warming Potential values. Global Warming Potential (GWP) values are used to convert emissions of non-CO2 gases like methane and nitrous oxide into equivalent units of carbon dioxide so that the global warming impacts of different greenhouse gases can be compared and added together into a single value in units of CO2 equivalents. In the original framework, GWP values were taken from the IPCC Fifth Assessment Report (AR5). It now uses updated GWP values from the IPCC Sixth Assessment Report (AR6). This change only affects emissions of non-CO2 gases, which occur in areas of forest fire and peat drainage.
6. Updated IPCC Tier 1 temperate forest removal factors and their uncertainties. The rate at which a hectare of undisturbed forest accumulates carbon in a year of growth is called the removal factor. Where locally relevant data is not available, the framework uses default IPCC Tier 1 removal factors for older (>20 year) secondary forests, originally published in Table 4.9 of the 2019 Refinement to the 2006 IPCC Guidelines for National Greenhouse Gas Inventories. However, some of the removal factors for older secondary temperate forests previously published by the IPCC had unrealistically high uncertainties associated with them. To address this, the IPCC has released an updated version of Table 4.9 with corrected removal factors and uncertainties for older secondary temperate forests. We have now updated our framework and its uncertainty analysis to use these corrected removal factors and uncertainties. Using these corrected temperate forest removal factors from the IPCC decreases average annual gross removals by about 25% in temperate forests and also dramatically reduces the previously unrealistically high uncertainty values around our estimates of gross carbon removals.
7. Updated planted forests data. In addition to natural forests, the model also estimates carbon emissions and removals in planted forests. Carbon fluxes in planted forests can differ greatly from those of natural forests depending on factors such as tree species, prior land use, stand age and management practices. To distinguish planted forests from natural forests, the framework previously used GFW’s Spatial Database of Planted Trees (SDPT) Version 1.0 which included extent and removal factor data for 173 million hectares of planted forest across 82 countries. GFW released SDPT Version 2.0 in 2024, which maps planted forest extent and removal factors for an additional 91 million hectares and 45 additional countries. The framework now uses the updated SDPT Version 2.0 to calculate carbon fluxes in planted forests.
8. Updated combustion factors for fire emissions. We have revised some of the values for our emissions calculations with updated values from the IPCC. Combustion factors represent what fraction of the available vegetation burns during a fire, which determines the amount of greenhouse gases released into the atmosphere. We have revised the combustion factors for boreal and temperate forests, specifically where there are fires associated with natural disturbances or an unknown driver of tree cover loss. While the change in combustion factors in boreal forests is very minor, the combustion factor in temperate forests is now significantly lower, thereby reducing emissions.
9. Updated soil carbon emission factors. We updated the fraction of soil organic carbon that is emitted from mineral soil when forests have been converted to permanent agriculture (stock-change factors) with updated IPCC values. The changes to stock-change factors in temperate and boreal forests are minor, but these factors are now higher for tropical forests, thereby increasing emissions.
10. Emissions from mineralization of soil nitrogen. In addition to estimating CO2 emissions from the loss of soil organic carbon, the model now also estimates nitrous oxide (N2O) emissions from the mineralization of soil nitrogen when soil organic carbon is lost. When a forest undergoes a land use change, nitrogen that was previously stored in the soil can be released as N₂O. For these estimates, the model follows IPCC guidelines where the driver of tree cover loss is permanent agriculture, shifting cultivation, hard commodity production or settlement and infrastructure.
11. Higher resolution drivers of tree cover loss. The framework originally used a global 10-km resolution drivers of tree cover loss map to assign emission factors from tree cover loss. We have updated to a new 1-km resolution map (available on GFW — learn more here) that includes additional drivers that typically occur at smaller spatial scales, like natural disturbances other than wildfires and hard commodities like mining.
Framework update | Previous version | Current version | Affects emissions | Affects removals | Year changed |
Belowground carbon ratio | Used global ratio of 0.26 for belowground carbon to aboveground carbon for non-mangrove forests. | Uses Huang et al. 2021 map of ratio of belowground carbon to aboveground carbon for non-mangrove forests. This ratio map was extended outwards to fill gaps in the original map. | Yes | Yes | 2023 |
Years of tree cover gain | Covered 2000-2012, from Hansen et al. 2013 | Covers 2000-2020, from Potapov et al. 2022 | Yes | Yes | 2023 |
Fire data | MODIS burned area, from Giglio et al. 2018 | UMD’s tree cover loss from fires, from Tyukavina et al. 2022 | Yes | No | 2023 |
Peat extent |
|
| Yes | No | 2023 |
Global Warming Potential (GWP) values where peat drainage and fires occur | The IPCC Fifth Assessment Report, Table 8.7. GWP-100 is 28 for methane and 265 for nitrous oxide (no climate-carbon feedback) | The IPCC Sixth Assessment Report, Table 7.15. GWP-100 is 27 for methane (non-fossil) and 273 for nitrous oxide | Yes | No | 2023 |
Temperate older secondary forest (>20 year) removal factors and their uncertainties | 2019 Refinement to the 2006 IPCC Guidelines for National Greenhouse Gas Inventories, Volume 4, Chapter 4, Table 4.9 | 4th Corrigenda to the 2019 Refinement to the 2006 IPCC Guidelines for National Greenhouse Gas Inventories, Volume 4, Chapter 4, Table 4.9 (removal factors for other climate domains and ages not updated) | Yes | Yes | 2024 |
Planted forest removal factors and their uncertainties | Yes | Yes | 2024 | ||
Fire emission combustion factors | 2006 IPCC Guidelines for National Greenhouse Gas Inventories, Volume 4, Chapter 2, Table 2.6 | 2019 Refinement to the 2006 IPCC Guidelines for National Greenhouse Gas Inventories, Volume 4, Chapter 2, Table 2.6 | Yes | No | 2025 |
Emissions from mineralization of soil nitrogen | Not previously included | 2019 Refinement to the 2006 IPCC Guidelines for National Greenhouse Gas Inventories, Volume 4, Chapter 11, p. 11.20, Equation 11.8 | Yes | No | 2025 |
Higher resolution drivers of tree cover loss | Curtis et al. 2018 (updated through 2023) | Sims et al. 2025 (updated through 2024) | Yes | No | 2025 |
Note: Removal factors in temperate forests and for planted forests affect emissions as well as removals because the framework calculates emissions based on the amount of carbon in the year 2000 plus carbon accumulated until the year tree cover loss.
How do these changes impact GHG fluxes and their uncertainties?
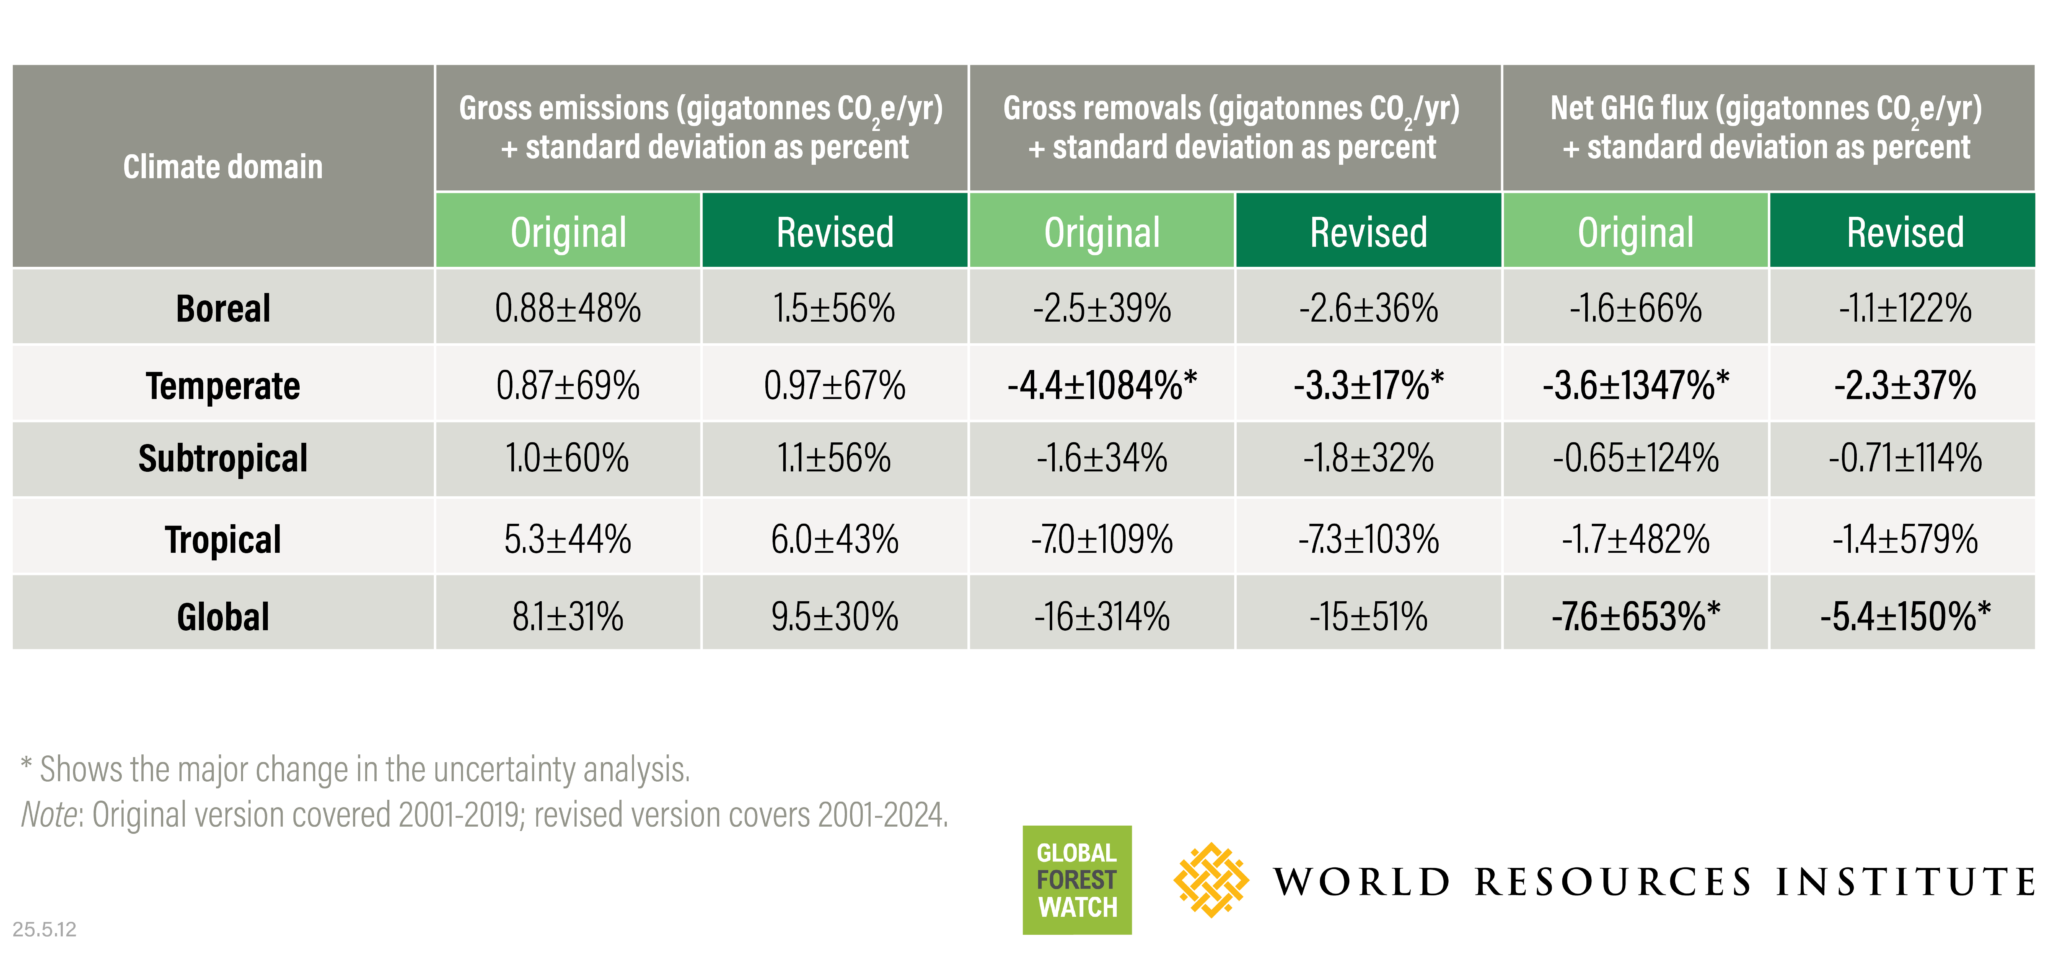
The combined effect of updates to the framework results in increased average annual gross emissions and decreased average annual gross removals. Increased gross emissions in the latest version is due to higher forest loss and consequent emissions in the years not covered by the original version (2020-2024). Decreased gross removals is primarily due to the lower corrected removal factors from the IPCC. Average annual net flux has decreased as a result of both increased gross emissions and decreased gross removals.
The updates to the framework have also resulted in changes in the calculated uncertainties. In the original framework, uncertainty of gross carbon removals in temperate forests was more than 10 times larger than the removals themselves (-4.4 gigatonnes CO2/yr ± 1084%), also resulting in unrealistically large uncertainties for net fluxes in temperate forests and for gross removals and net fluxes globally. In the most recent updates, uncertainty for gross carbon removals in temperate forests is now one-sixth of gross removals (-3.3 gigatonnes CO2/yr ± 17%). Although over 20 components of the framework are reflected in the uncertainty analysis, almost all the reduction in uncertainty for removals and net flux was due to the revised uncertainty for removals in older temperate forests. The largest remaining source of uncertainty in the framework is carbon removals in tropical forests.
What’s next for the forest carbon flux framework?
GFW is moving towards monitoring forest extent and change with height-based measurement of forests, and our carbon monitoring framework is following suit. Forthcoming maps of forest extent, loss and gain based on changes in canopy height will contribute to more detailed timeseries of forest carbon emissions and removals.
GFW is also collaborating with partners to develop new, data-driven methods to improve the spatial and temporal distribution of forest carbon sequestration rates in the world’s standing forests using a few different approaches. These will improve one of the coarsest parts of the current framework.
Finally, the forest flux framework will be integrated into a broader Agriculture, Forestry and Other Land Uses (AFOLU) greenhouse gas flux framework in 2025 and 2026. This will expand greenhouse gas monitoring from forests to all land uses (such as grasslands), as well as incorporate the “A” (agriculture) of AFOLU by mapping emissions from agricultural activities such as drained cropland soils, fertilizer application and rice cultivation, as well as emissions from the world’s livestock systems.
In the years since its release, GFW’s forest carbon flux monitoring framework has been used in a variety of science and policy applications to make local, data-driven decision making around forest carbon possible. The recent improvements, and bigger updates on the horizon, will continue to use the best available data to help the global community monitor, assess and prioritize action to reduce emissions from deforestation, increase carbon sequestration from forest restoration and protect and enhance the global forest carbon sink.
* Mangrove forests store proportionately more biomass in their root systems than other forest types; this is reflected in the framework.
We are continuously working to improve GFW data sets, and feedback from users can help us understand current gaps in forest carbon monitoring and decide what improvements to make next. If you have used any of GFW’s carbon data, please tell us about it.
This piece was originally published in 2023. It was updated in May 2025 to reflect the latest developments with the forest carbon flux data.
Explore More Articles
Looking for the Quickest Signal of Deforestation or Vegetation Disturbance Globally? Turn to GFW’s Integrated Disturbance Alerts
GFW’s integrated alerts layer combines the power of four alert systems for an improved view of deforestation and other vegetation disturbances globally.